Microsoft (MSFT) Stock Analysis – July 18, 2025
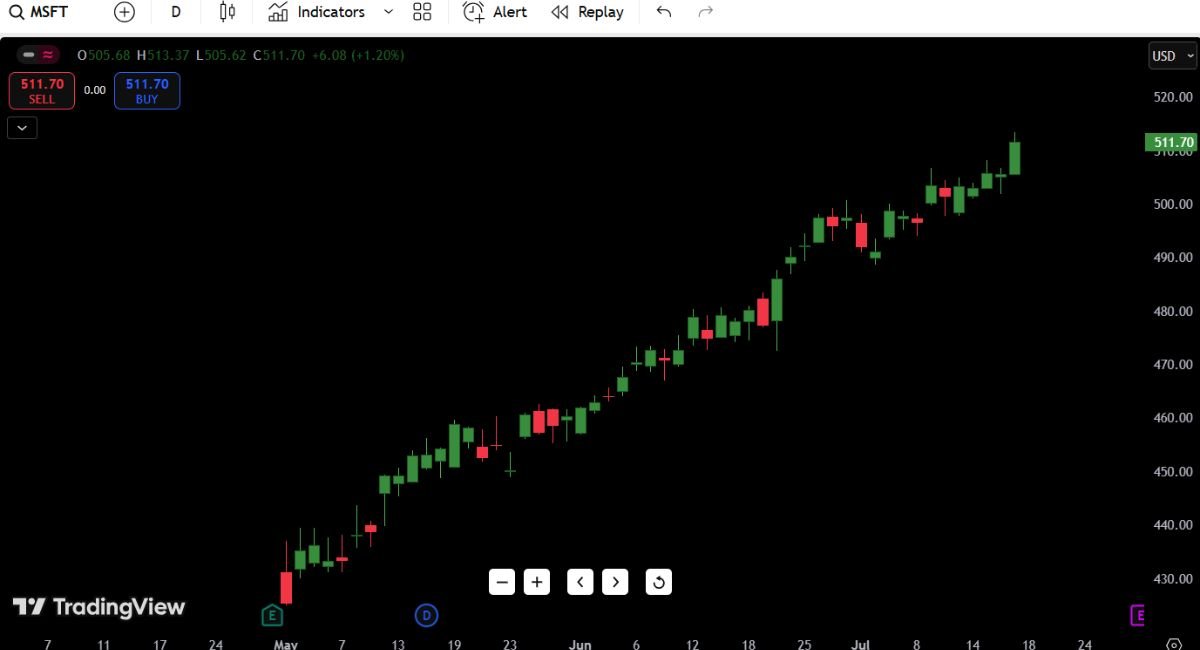
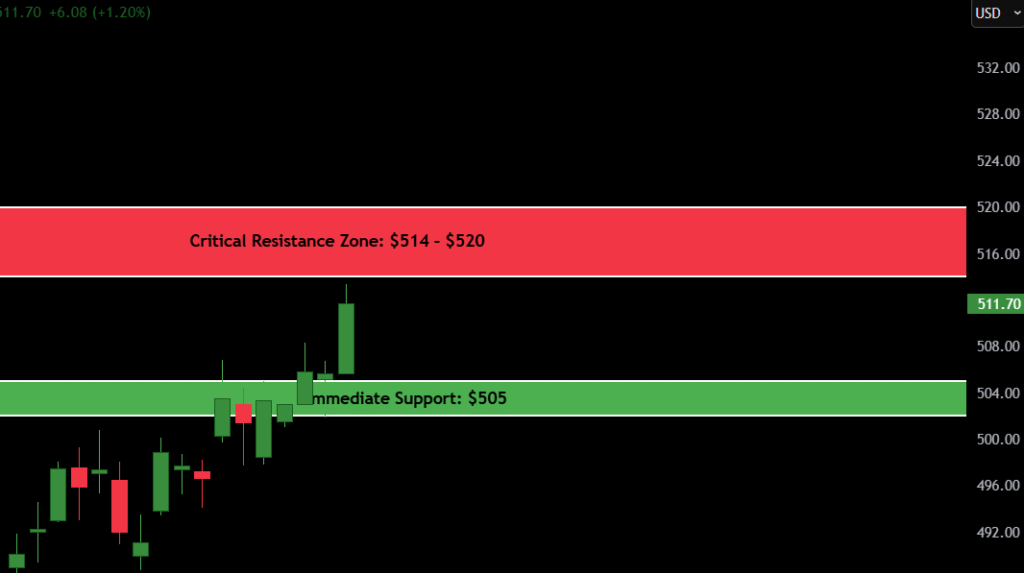
Microsoft (MSFT) stock price today is $511.70, up +1.20% on the day. The daily candle just closed green, clean, and full-bodied—buyers are clearly in control.
- Trend: Strong, extended uptrend (3-month run)
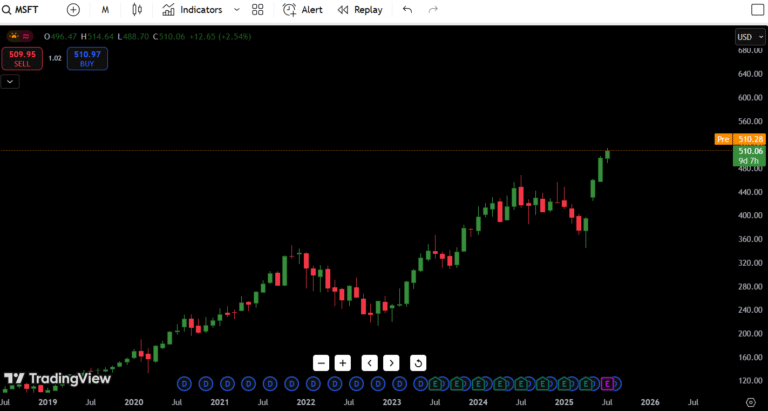
- 52-Week Range: $312.10 – $513.37 (today’s high)
- Critical Resistance Zone: $514 – $520
- Immediate Support: $505 – recent breakout base
- Watch for: Retest of breakout zone or fakeout over 52W high
Also Read: Microsoft corporation bullish and bearish analyst opinions
Contents
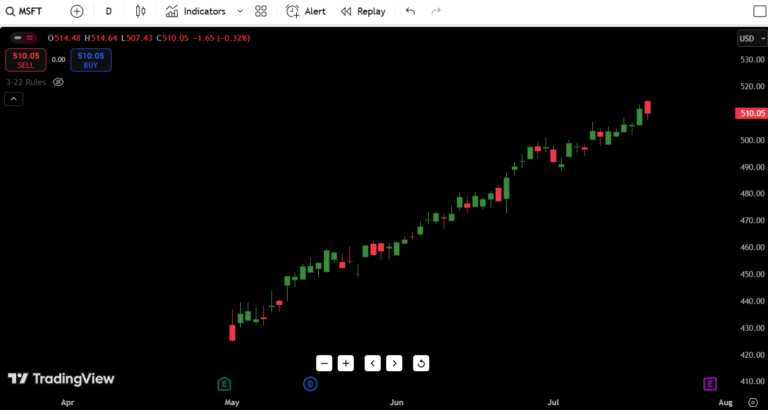
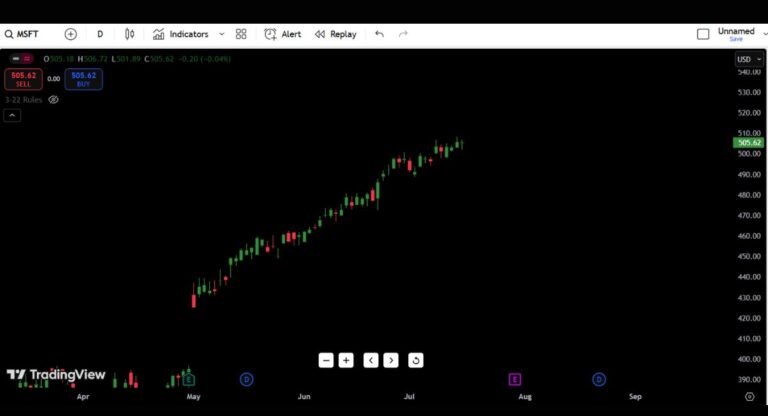
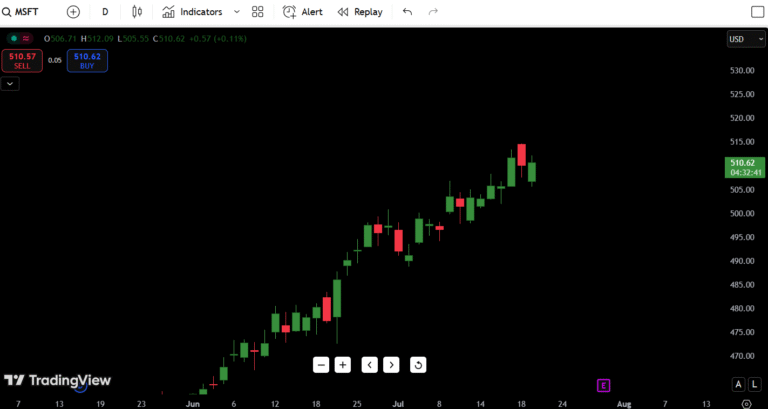
MSFT Candlestick Chart Analysis
Alright, let’s talk price action like we’re reading the tape:
Trend Structure – Clean Uptrend
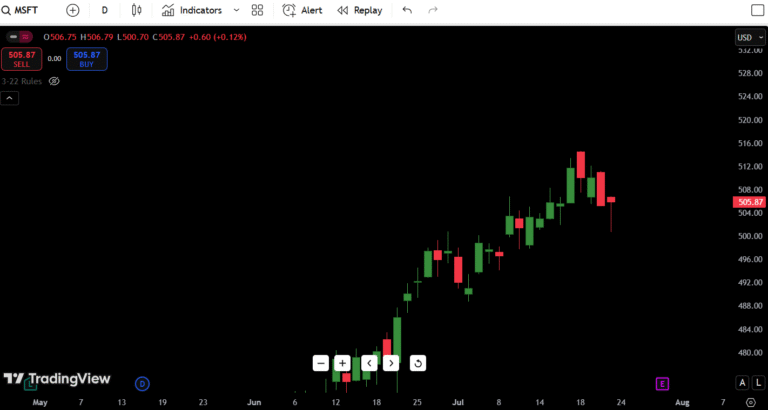
- Since late April, MSFT has barely taken a breath.
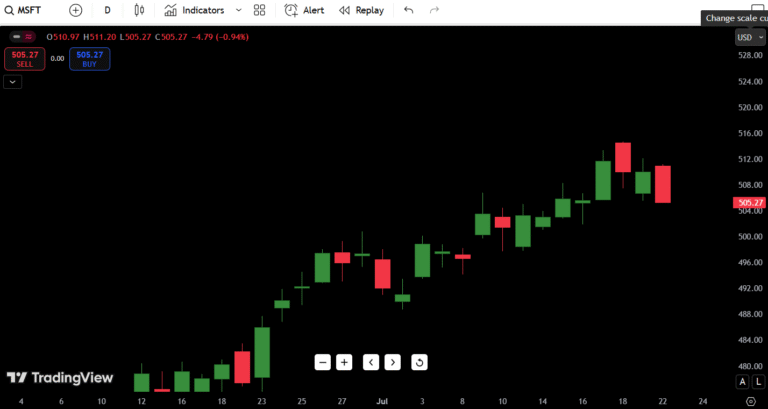
- We’re seeing higher highs, higher lows, and orderly pullbacks.
- The 3-week consolidation from late June to mid-July built up energy—and now boom, we’ve got a breakout candle.
Today’s Candle – Breakout, Not a Fakeout
- Open: $505.68
- Close: $511.70
- High: $513.37
That’s a power candle, no top wick means bulls held it into the close—not profit-taking, not hesitant buying. This is conviction.
It’s the kind of candle that usually attracts trend-following algos and late FOMO traders. Volume wasn’t visible, but based on price movement, it’s likely strong.
Key Chart Signals
- Breakout above range: The $505 zone was a resistance shelf—MSFT has now closed cleanly above it
- No bearish divergence signs: Without RSI/MACD on screen, we look at price action — and it’s bullish, not exhausted.
- No doji, no reversal candles: Just clean follow-through.
If this were a fakeout, we’d expect upper wick rejection. We didn’t get it.
| Type | Price Level | Description |
|---|---|---|
| Resistance 1 | $514 | 52-week high – breakout test zone |
| Resistance 2 | $520 | Round number + psychological barrier |
| Resistance 3 | $528 | Fibonacci 1.272 extension target |
| Resistance 4 | $545 | Projected measured move |
| Support 1 | $505 | Breakout base – must hold zone |
| Support 2 | $492 | Last demand candle |
| Support 3 | $478 | Range low from June consolidation |
| Support 4 | $460 | Volume shelf + 20EMA zone |
$505 is critical. If MSFT re-tests this zone and buyers step in again, we could see $520+ quickly. If $505 fails, look to $492 as a catch.
7-Day Price Forecast for MSFT
| Date | High | Low | Expected Close |
|---|---|---|---|
| Jul 18 | $514 | $505 | $511.70 |
| Jul 19 | $518 | $507 | $515 |
| Jul 20 | $521 | $510 | $519 |
| Jul 21 | $526 | $512 | $524 |
| Jul 22 | $530 | $515 | $528.50 |
| Jul 23 | $537 | $518 | $534 |
| Jul 24 | $542 | $520 | $538 |
Based on trend strength and structure, here’s our near-term outlook:
Thesis: As long as $505 holds, the stock has fuel to grind toward the $530–540 range.
Buy, Hold, or Sell Recommendation
| Action | Condition | Reason |
|---|---|---|
| BUY | Closes above $514 resistance | Breakout + volume + trend intact |
| HOLD | Between $505–$514 | Watching for retest or momentum |
| SELL | Breaks below $492 | Failed breakout, loss of structure |
Why I’m Bullish:
We’ve got:
- A clean breakout candle
- 3 weeks of consolidation just resolved higher
- No topping structure, no reversal pattern
I’d personally look to buy dips into $507–$509, with stop just below $504. This keeps your risk tight, but gives room for a $520–$530 reward zone. Classic 2:1 or better risk-reward setup.
Not chasing. But I’m not fading this trend either. This is strength.
Fundamental Catalysts to Watch
- Earnings Report: July 30th — Big potential volatility mover
- AI Hype: MSFT’s investment in OpenAI and Azure’s AI infrastructure is not priced out yet
- Analyst Upgrades: JPMorgan just raised target to $540 — Street is bullish
- Macro Catalysts: Fed speak + CPI could inject volatility into tech
Overall: Fundamentals support this trend continuation. Unless we get a shock CPI/Fed hawkish twist, MSFT should hold strong.
Final Thoughts – My Personal Take
As someone who’s traded through fakeouts, double tops, and bull traps, I know how deceptive breakout candles can be. But this isn’t one of those.
Why?
- Volume follow-through expected
- No exhaustion wicks
- Clean structure — no chop, no mess
Here’s my setup:
- Buy Zone: $507–509
- Stop: $503
- Target 1: $520
- Target 2: $530–535
Bias: 🔥 Bullish
Risk: 🔺 Moderate (due to earnings volatility in 2 weeks)
Pattern Watch: Bull Flag continuation
This is exactly the kind of trade I like to see after a clean coil breakout — just don’t FOMO the top wick. Wait for the dip, ride the push.

