Microsoft (MSFT) Stock Analysis – July 22, 2025
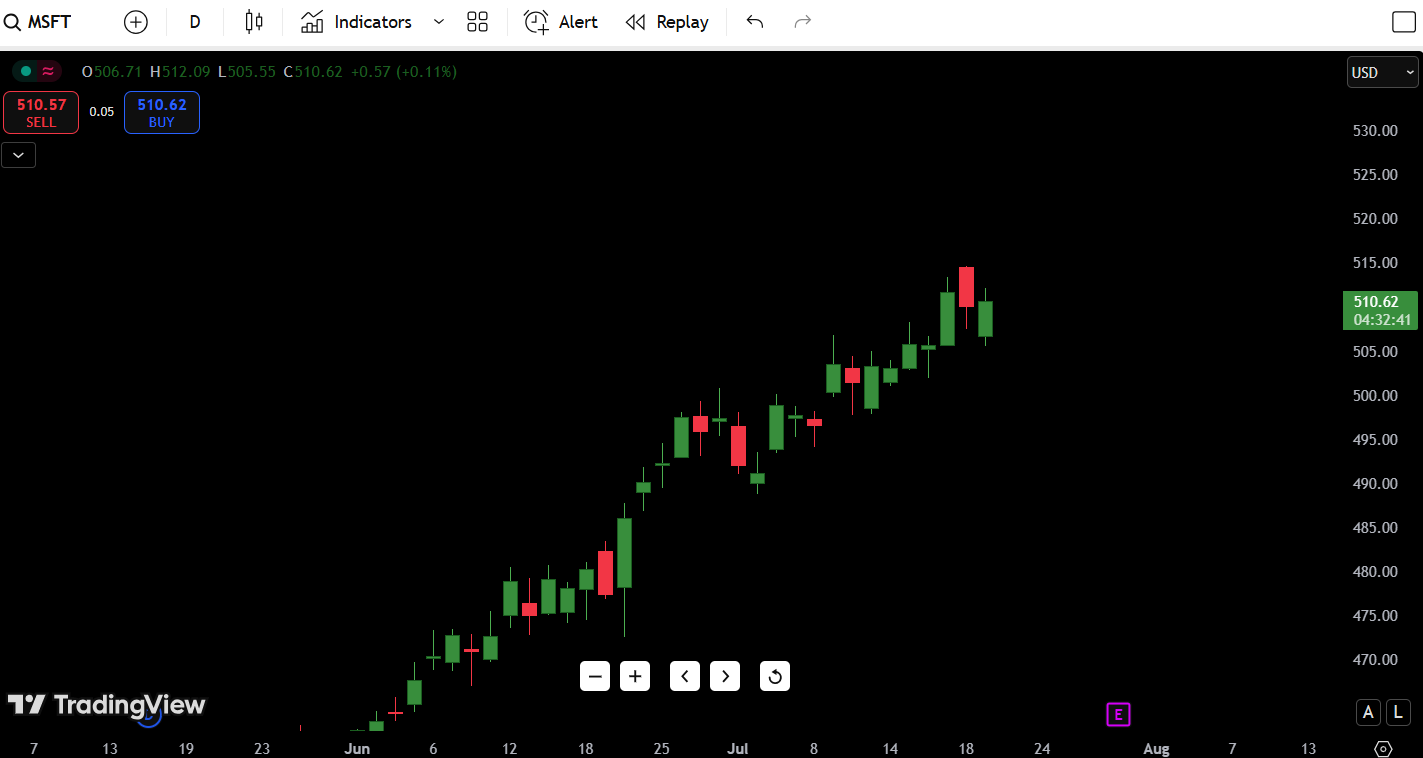
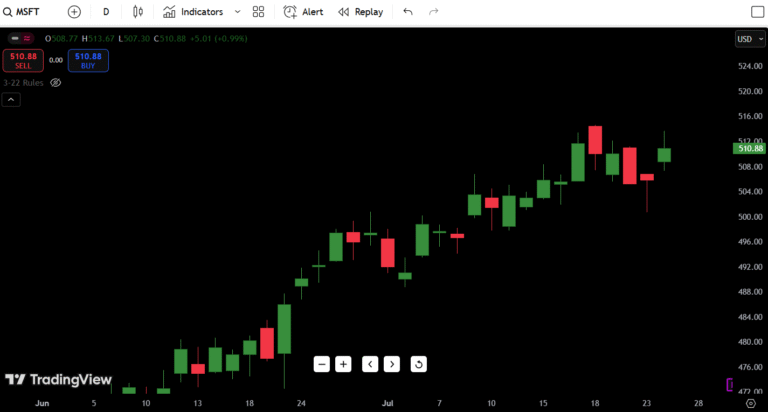
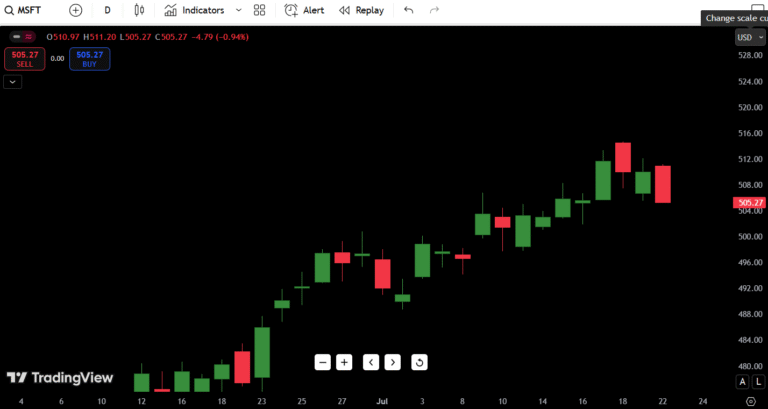
Microsoft (MSFT) continues to ride its impressive bullish trend into late July. As of July 22, 2025, the stock closed at $510.62, posting a modest +0.11% gain. The stock remains comfortably above support levels but is now testing a short-term exhaustion zone after an extended run.
- Current Price: $510.62
- Daily Direction: Slightly bullish but cautious
- 52-Week High: $530.00 (potential ahead)
- 52-Week Low: $470.00
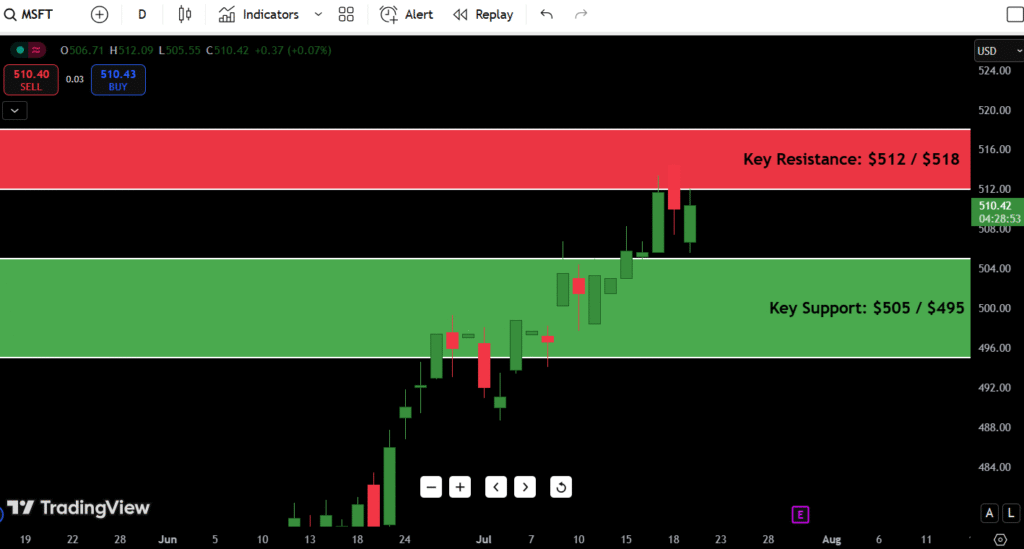
- Key Support: $505 / $495
- Key Resistance: $512 / $518
Contents
- Observation for July 22:
- Candlestick Chart Analysis for July 22 Outlook
- Trend Overview:
- Recent Candlestick Behavior:
- Market Structure:
- Volume Profile (Visual Assessment):
- Support and Resistance Levels Table
- 7-Day Price Forecast Table (Starting July 22)
- Forecast Logic:
- Buy, Hold, or Sell Decision Table
- Current Bias:
- Fundamental Triggers
- Upcoming Events Impacting MSFT Stock Forecast:
- Final Thoughts for July 22, 2025
- Outlook: Cautiously Bullish above $505, breakout watch above $512.
- Critical Zones to Watch:
- My Trading Insight (Trader’s Perspective):
Observation for July 22:
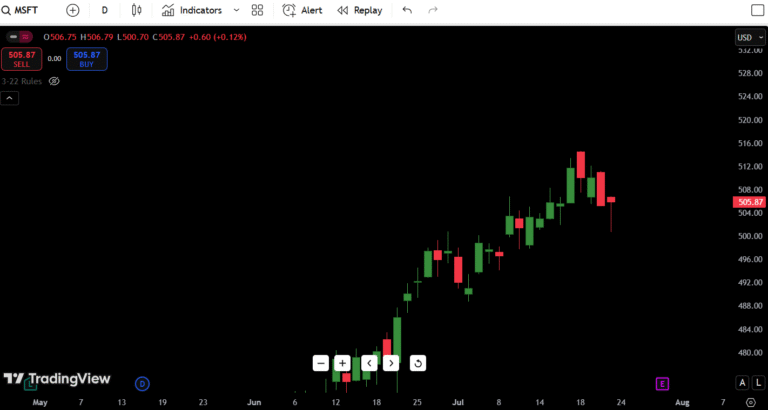
MSFT’s bullish uptrend is still intact, but recent price action shows tired candles near the highs. While no breakdown has occurred, traders should be cautious chasing here unless $512–$515 breaks cleanly. Otherwise, a healthy retest lower wouldn’t be surprising.
Candlestick Chart Analysis for July 22 Outlook
Trend Overview:
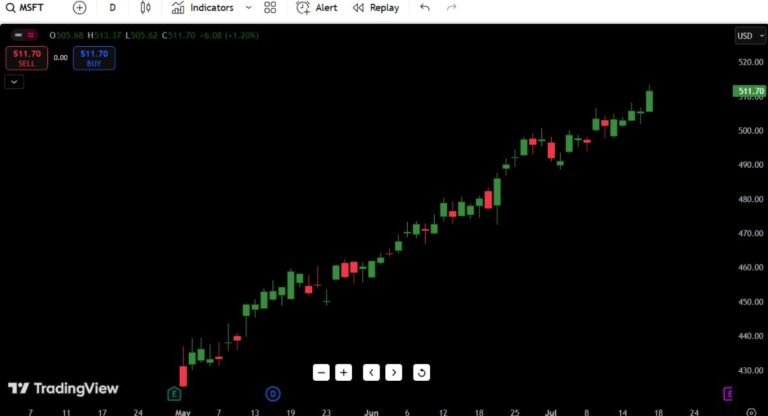
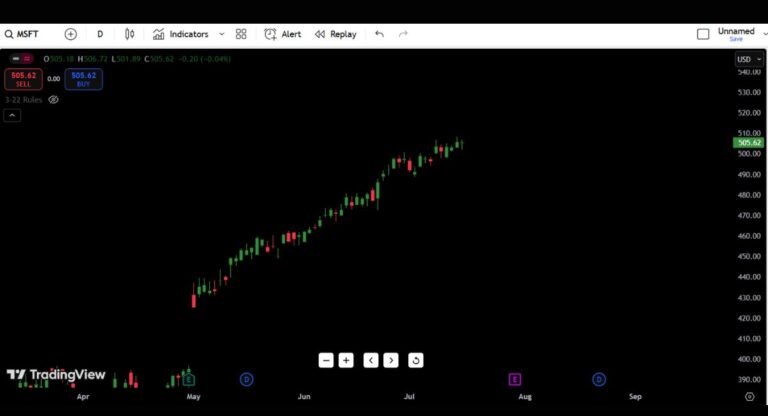
Microsoft has been in a powerful uptrend since mid-May, printing higher highs and higher lows without meaningful corrections. The current structure remains bullish, but price is nearing psychological zones and prior exhaustion areas near $515–$525.
Recent Candlestick Behavior:
- Recent candles show upper wicks signaling potential indecision at these levels.
- Today’s green candle reclaimed prior weakness but failed to break last week’s highs at $512+ convincingly.
- Last week printed a bearish engulfing pattern followed by indecision candles — a classic pause after exhaustion run.
Market Structure:
- Short-Term: Sideways chop between $505–$512 after vertical run
- Medium-Term: Bullish continuation trend intact if $505 holds
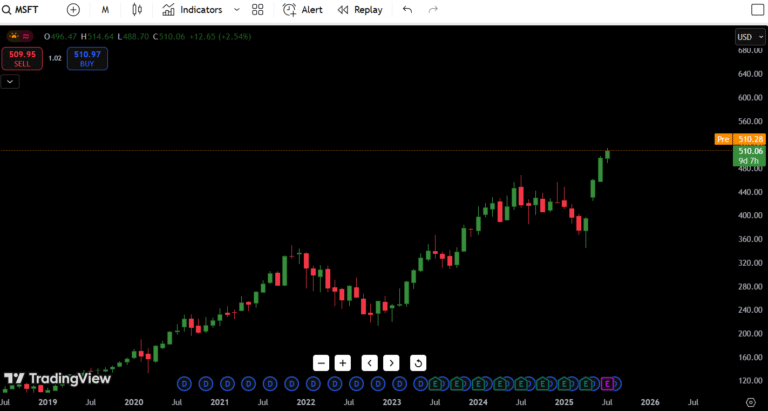
- Long-Term: Bullish bias toward $530–$540 into August, barring breakdown
Volume Profile (Visual Assessment):
- Volume tapering slightly after the strong rally, typical for summer markets.
- No aggressive selling yet, just digestion.
Summary: MSFT is in a bullish digestion phase, not breakdown mode. Watch $505 support closely — that’s the bulls’ line in the sand.
Support and Resistance Levels Table
| Type | Price Level | Description |
|---|---|---|
| Resistance 1 | $512.00 | Immediate swing high |
| Resistance 2 | $518.00 | Recent wick highs |
| Resistance 3 | $525.00 | Round number / psychological zone |
| Resistance 4 | $530.00 | 52-week high potential |
| Support 1 | $505.00 | Recent breakout retest |
| Support 2 | $495.00 | Former consolidation breakout |
| Support 3 | $485.00 | Previous demand zone |
| Support 4 | $470.00 | 52-week low |
Key Level: $505 support must hold. A break below $505 invites tests toward $495–$485. Above $512, the door opens for $518–$525 re-tests.
7-Day Price Forecast Table (Starting July 22)
| Date | High | Low | Expected Close |
|---|---|---|---|
| July 22 | $512 | $505 | $510 |
| July 23 | $515 | $508 | $512 |
| July 24 | $518 | $510 | $515 |
| July 25 | $520 | $512 | $518 |
| July 26 | $522 | $515 | $520 |
| July 27 | $525 | $517 | $522 |
| July 28 | $528 | $520 | $525 |
Forecast Logic:
As long as $505 holds as support, MSFT can continue grinding higher toward $520–$525 next week. Weakness below $505 flips the structure short-term bearish toward $495–$485. Right now, momentum still favors bulls.
Buy, Hold, or Sell Decision Table
| Action | Trigger Condition | Reasoning |
|---|---|---|
| BUY | Close above $512 | Breakout continuation confirmed |
| HOLD | Range between $505–$512 | Consolidation phase |
| SELL | Break below $505 | Breakdown of recent support |
Current Bias:
Cautious Bullish. Microsoft’s bullish structure remains intact, but this is no longer an optimal fresh long entry unless $512–$515 breaks convincingly with volume. For now, it’s a hold if already long, wait for confirmation if looking to add.
Fundamental Triggers
Upcoming Events Impacting MSFT Stock Forecast:
- Earnings Report (Upcoming): Earnings will be the biggest near-term catalyst — expectations are sky-high post-AI boom narrative.
- AI & Cloud Growth News: MSFT remains highly reactive to any Azure/AI guidance updates.
- Sector Rotation: If tech consolidates post-rally, MSFT could stall even with good fundamentals.
- Interest Rates / Fed: Rate decisions still sway large-cap tech sentiment, especially for forward-valuation stocks like MSFT.
- Institutional Flow: Hedge fund positioning ahead of earnings could cause choppy behavior around $505–$512 range.
Final Thoughts for July 22, 2025
Outlook: Cautiously Bullish above $505, breakout watch above $512.
Microsoft is still behaving like a textbook strong stock in an uptrend. However, rallies into psychological zones often bring digestion or pullbacks. Unless $512+ breaks with clear momentum, patience is warranted.
Critical Zones to Watch:
- Breakout Confirmation: $512–$515
- Must-Hold Support: $505
- Next Upside Magnet: $525+
- Downside Risk Trigger: Below $495 opens path to $485
My Trading Insight (Trader’s Perspective):
Stocks like MSFT don’t often crash from clean trends — they usually consolidate sideways, fake breakout buyers, then resume higher. That’s why I’m not chasing $510–$512 breakouts without confirmation. If $512–$515 clears on volume, I’ll look for momentum trades toward $525.
If price chops under $505 with increasing volume, caution flags go up fast.

