At Brndups, we bring real chart-based insights, backed by technical indicators, market sentiment, and honest trading logic. Whether you’re a swing trader, long-term investor, or just love candlestick patterns. we break down U.S. stocks in a way that actually helps you trade better.
What You’ll Find Here – Analysis, Forecasts & Chart Insights of USA Stocks
- Daily Stock Analysis – From Tesla (TSLA) to Amazon (AMZN), get clear chart breakdowns using RSI, MACD, volume trends, and candlestick behavior.
- 7-Day Forecasts – We don’t just analyze — we predict. Get a trader-friendly forecast table with price targets based on the latest data.
- Support & Resistance Maps – Know exactly where smart money enters or exits.
- Buy, Hold, or Sell Calls – Backed by technicals, not hype.
Why Traders Trust Us
We mix technical know-how with a real-world trader’s mindset. You’ll never read generic phrases like “the market is volatile” we go deeper.
Our analysis uses real indicators:
- RSI shifts to catch momentum
- MACD crossovers to confirm entries
- Volume spikes to spot breakout traps
- And daily/weekly candle patterns you should care about
Plus, we explain why we call a stock a buy, sell, or hold. Transparency builds trust.
Latest Coverage
Explore fresh breakdowns on trending stocks, including:
- $NVDA chart retest at key resistance
- $AAPL showing hidden bullish divergence
- $TSLA inside bar pattern – what it means
(All reports updated with today’s data and clear takeaways)
Want an Edge in This Market?
Subscribe to get:
📬 Daily chart breakdowns
📊 Weekly forecast tables
🎯 Breakout zone alerts
You’re not trading alone. We’ve got your back.
- 블랙툰 주소가장 인기 있는 한국 웹툰 웹사이트에 오신 것을 환영합니다. 이곳에서 블랙툰 최신 주소와 중요한 정보를 얻으실 수 있습니다. 구글 키워드 플래너에 따르면, 한국에는 최신 블랙툰 주소를 검색하는 사람이 천만 명이 넘습니다. 하지만 안타깝게도 온라인에는 수백 개의 불법 복제 및 스팸 웹사이트가 넘쳐나기 때문에 웹툰을 읽을 수 있는 진짜 웹사이트를 알지 못한다는 것입니다. 스팸 웹사이트에 접속하면… Read more: 블랙툰 주소
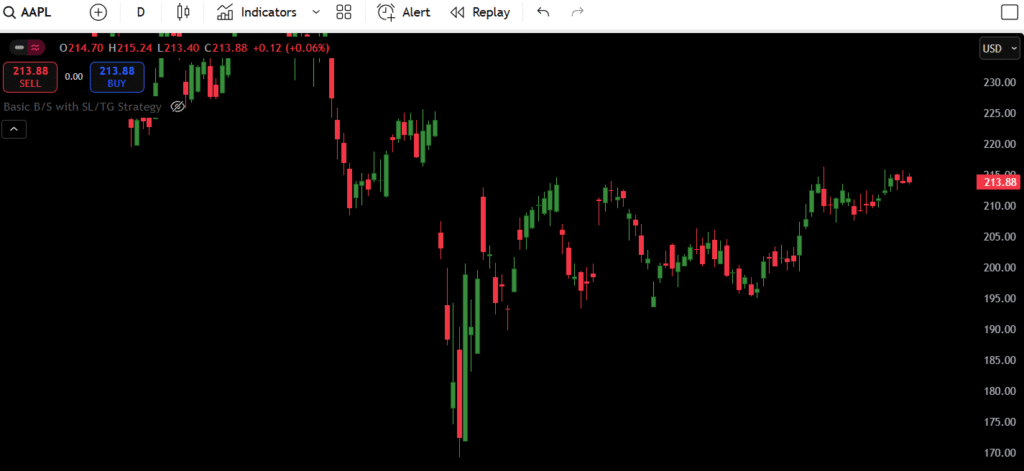
- Apple (AAPL) Daily Breakdown – July 28, 2025Let’s cut through the noise. Apple just closed at $213.88. Flat day. Not much of a headline grabber unless you’re actually watching price action. And if you’re a trader worth your salt, you are. We’ve got a tight range, low volume churn, and price action pressing up into resistance. This setup? It’s like a spring… Read more: Apple (AAPL) Daily Breakdown – July 28, 2025
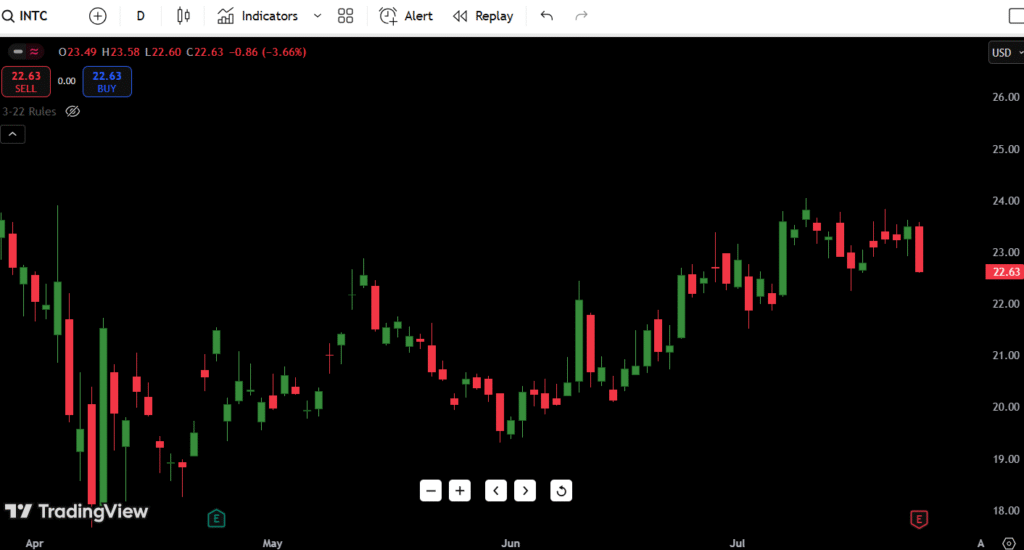
- Intel Corporation (INTC) Stock Price on July 25, 2025: Expert Analysis & TrendsAs of today, Intel Corporation (NASDAQ: INTC) is trading at $22.63, down sharply by 3.66% on the day. This marks a clear bearish shift after failing to hold above short-term support near $23.50. INTC is now down over 25% from its recent peak of $30.10, putting pressure on bulls as we head deeper into earnings… Read more: Intel Corporation (INTC) Stock Price on July 25, 2025: Expert Analysis & Trends
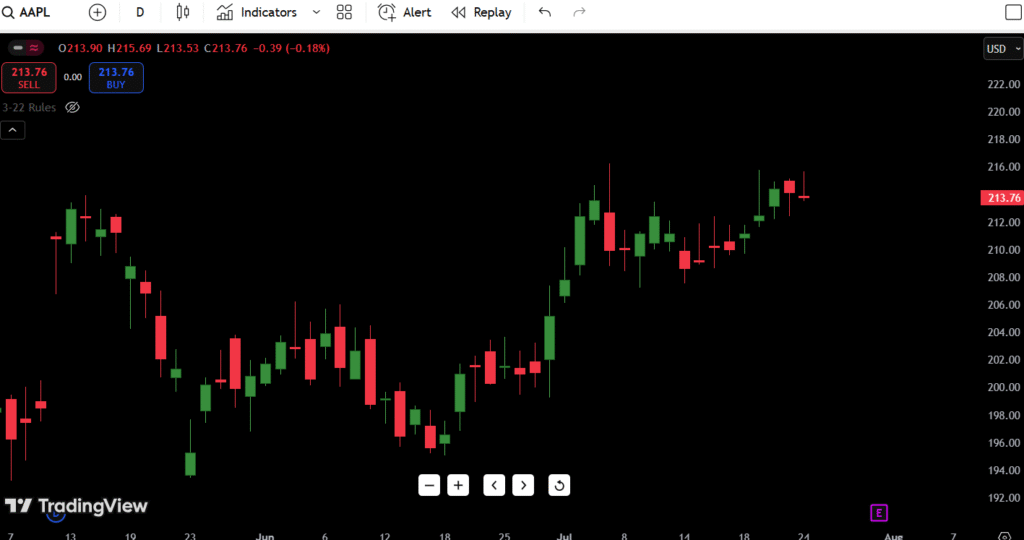
- Apple Inc. (AAPL) Stock Price on July 25, 2025: Expert Analysis & TrendsAs of July 25, 2025, Apple Inc. (AAPL) is trading at $213.76, marking a minor pullback of 0.18% on the day. The stock reached a session high of $215.69 and a low of $213.53, showing tight range-bound behavior after a recent bullish stretch. While the broader trend remains bullish, today’s price action flashed indecision—potentially signaling… Read more: Apple Inc. (AAPL) Stock Price on July 25, 2025: Expert Analysis & Trends
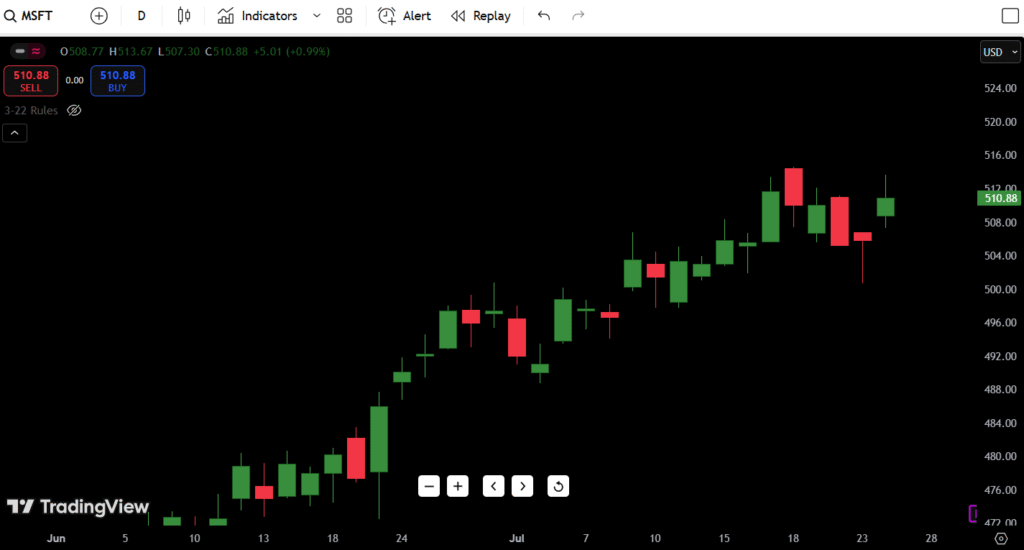
- Microsoft (MSFT) Stock Price on July 25, 2025: Expert Analysis & TrendsAs of July 25, 2025, Microsoft (MSFT) is trading at $510.88, gaining +0.99% on the day and inching closer to its all-time highs. After printing a clean bullish reversal candle, MSFT is looking to reclaim upside momentum following a brief three-day pullback. Key Observation: MSFT bounced strongly after a near-perfect retest of the $502–$504 demand… Read more: Microsoft (MSFT) Stock Price on July 25, 2025: Expert Analysis & Trends
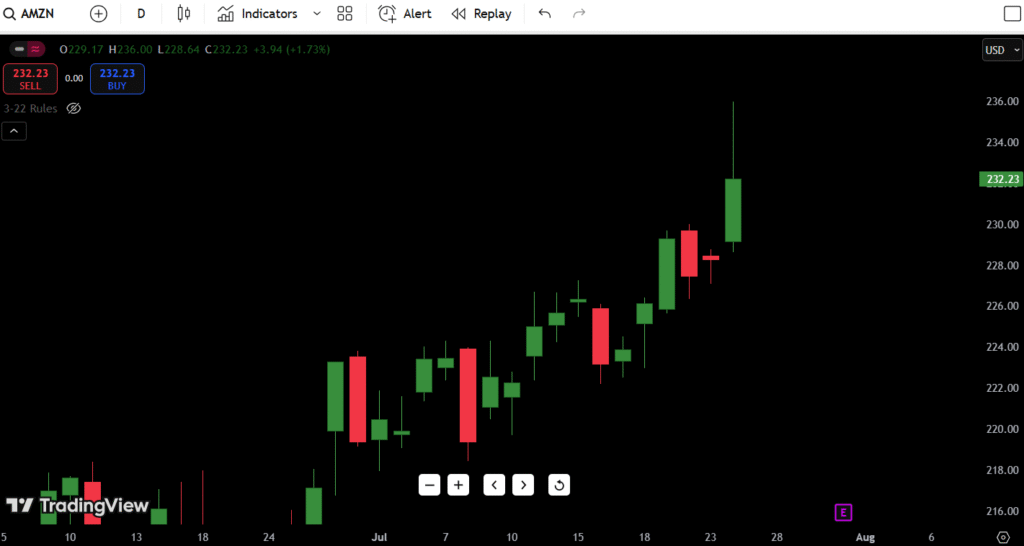
- Amazon (AMZN) Stock Price on July 25, 2025: Expert Analysis & TrendsAs of July 25, 2025, Amazon (AMZN) stock is trading at $232.23, up +1.73% on the day after printing a strong bullish daily candle. The e-commerce and cloud titan is pushing toward its recent highs, showing signs of potential breakout momentum after weeks of higher lows and consistent bullish structure. One critical takeaway from today’s… Read more: Amazon (AMZN) Stock Price on July 25, 2025: Expert Analysis & Trends
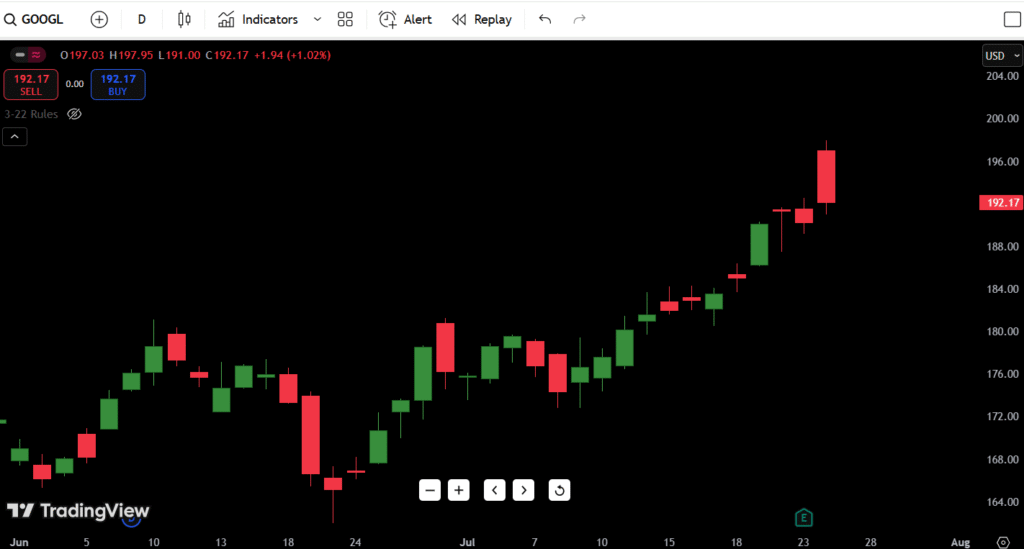
- Google (GOOGL) Stock Price on July 25, 2025: Expert Analysis & TrendsAs of July 25, 2025, GOOGL stock is trading at $192.17, up 1.02% on the day after hitting an intraday high of $197.95. This marks a strong run from recent swing lows and has put the stock within striking distance of its 52-week high of $199.47. The 52-week low remains far below at $118.35, showing… Read more: Google (GOOGL) Stock Price on July 25, 2025: Expert Analysis & Trends
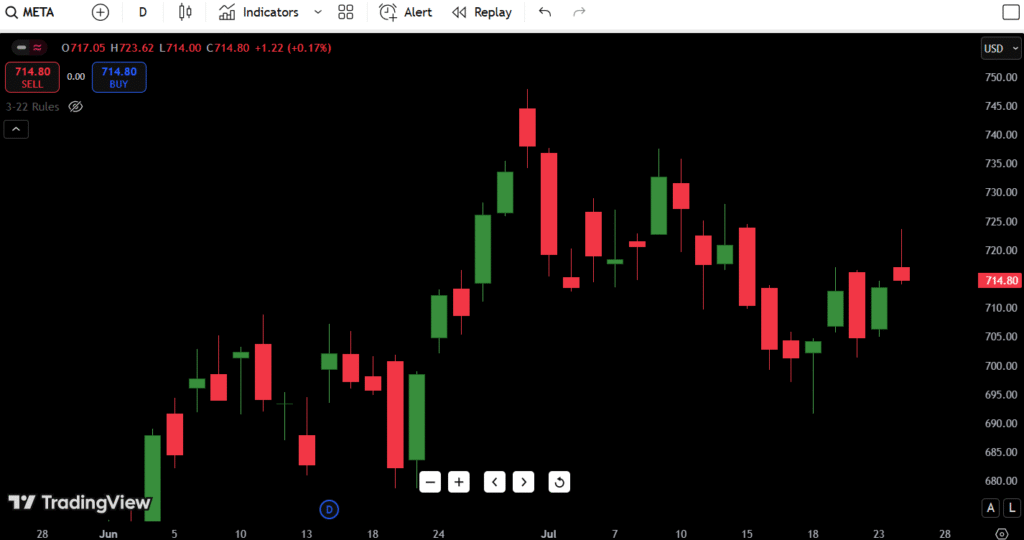
- Meta Platforms (META) Stock Price on July 25, 2025: Expert Analysis & TrendsMeta Platforms (META) closed today at $714.80, showing slight green on the day with a +0.17% gain. Price action remains choppy but is stabilizing after last week’s minor breakdown attempt. Today’s META stock forecast leans cautiously bullish, but price sits right at a key reaction zone. The candlestick chart suggests Meta is forming a base-building… Read more: Meta Platforms (META) Stock Price on July 25, 2025: Expert Analysis & Trends
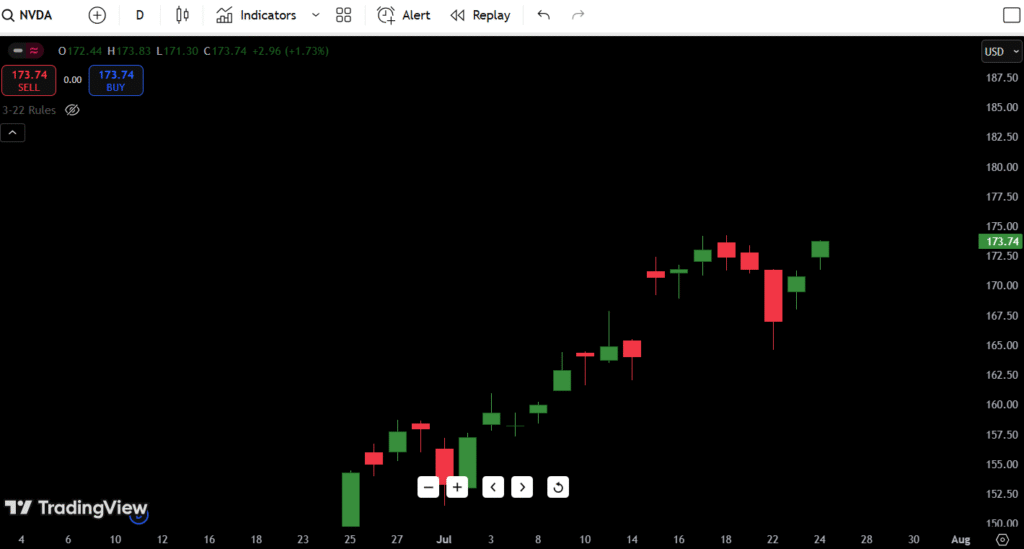
- NVIDIA (NVDA) Stock Price on July 25, 2025: Expert Analysis & TrendsAs of July 25, 2025, NVIDIA Corp. (NVDA) is trading at $173.74, closing the day up +1.73% after rallying from an intraday low of $171.30. This continues a multi-week uptrend, as NVDA pushes back toward local highs, following a textbook bounce off key demand near $167. Today’s price action adds conviction to the bullish continuation… Read more: NVIDIA (NVDA) Stock Price on July 25, 2025: Expert Analysis & Trends
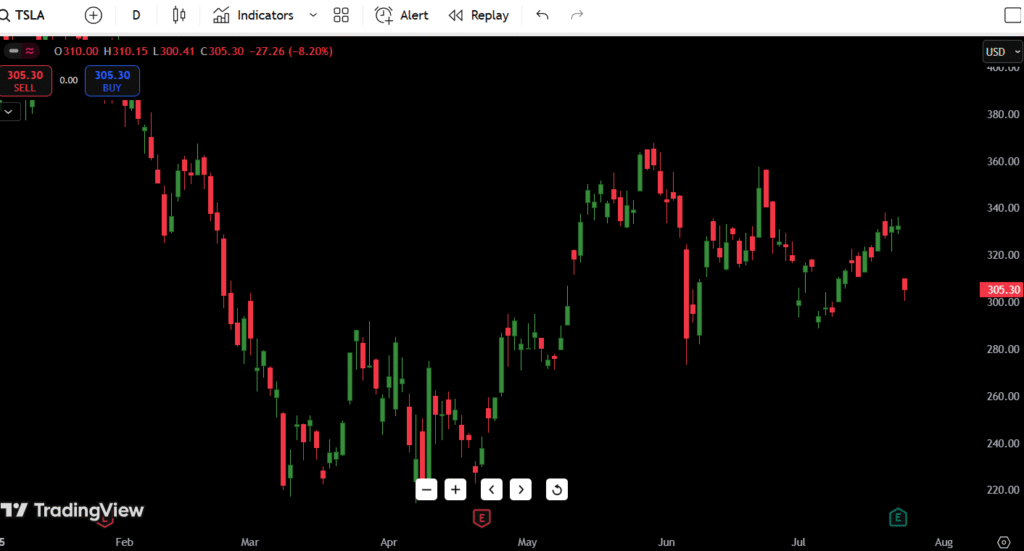
- Tesla (TSLA) Stock Price on July 25, 2025: Expert Analysis & TrendsAs of July 25, 2025, Tesla Inc. (TSLA) is trading at $305.30, closing the session down -8.20% on the day. That’s a brutal single-day loss of $27.26, wiping out nearly three weeks of bullish price action in one flush. The move comes after a gap down and hard rejection from the $340 region earlier this… Read more: Tesla (TSLA) Stock Price on July 25, 2025: Expert Analysis & Trends


