Tesla (TSLA) Stock Analysis – July 23, 2025
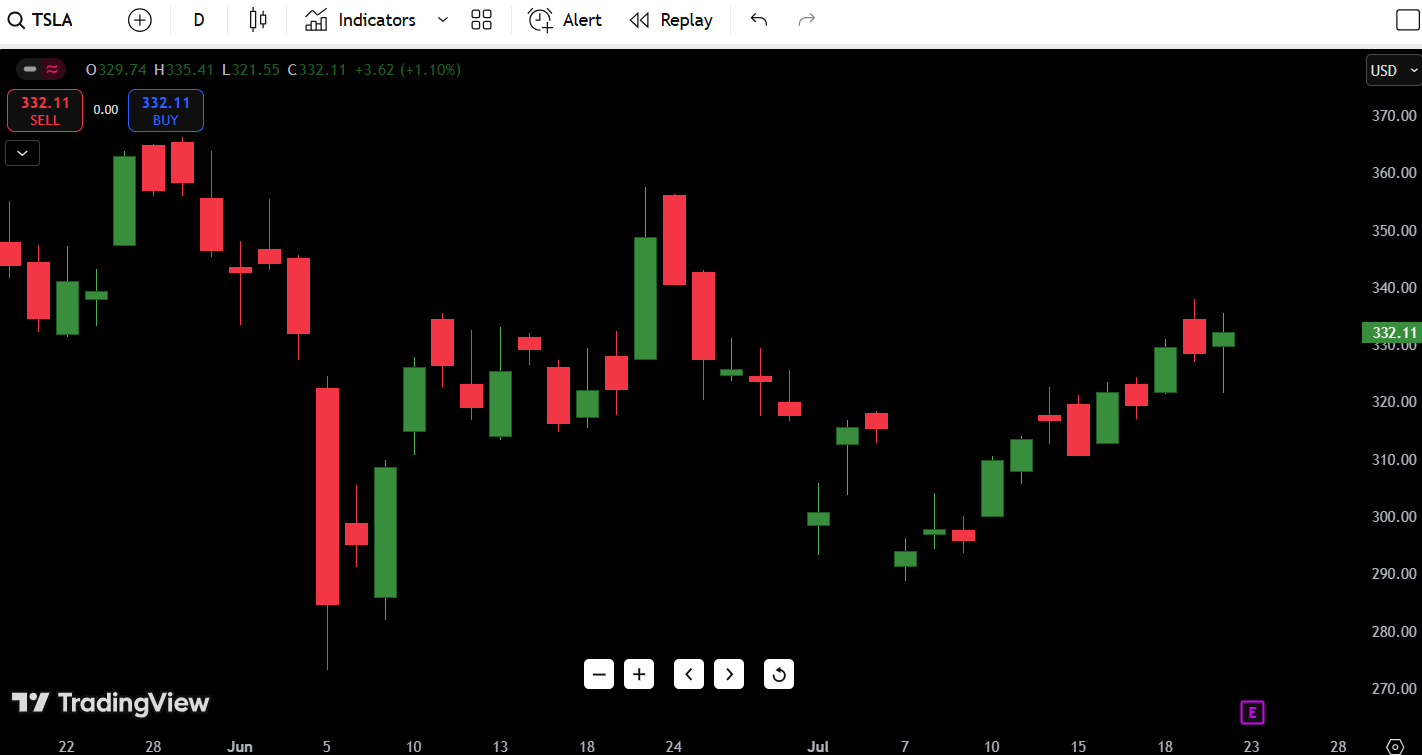
As of July 23, 2025, Tesla Inc. (TSLA) stock is trading at $332.11, up +1.10% on the day after holding above key support near $310. With the bulls pressing for continuation, Tesla is showing a potential bullish breakout setup just ahead of a minor resistance zone.
- TSLA Stock Price Today: $332.11
- Tesla Forecast (July 23): Bullish above $326
- Daily Direction: Uptrend continuation
- 52-Week High: $384.29
- 52-Week Low: $193.60
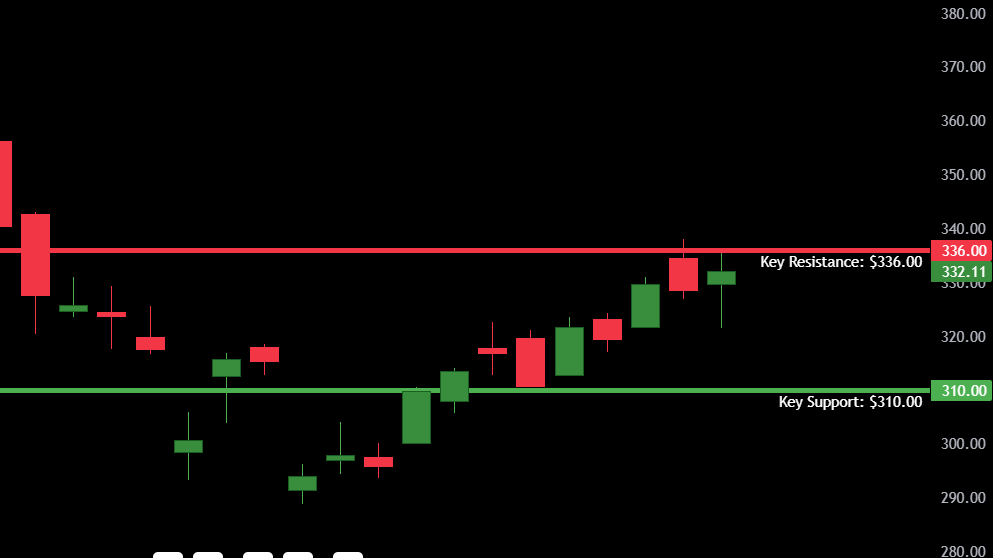
- Key Support: $310.00
- Key Resistance: $336.00
Critical Note: TSLA just printed another strong green candle with a higher low, continuing a clean bullish trend off the $271 low set earlier this month. Momentum buyers are returning, and volume has begun to build — setting the stage for a potential breakout.
Contents
Candlestick Chart Analysis – Tesla’s Bullish Momentum Builds
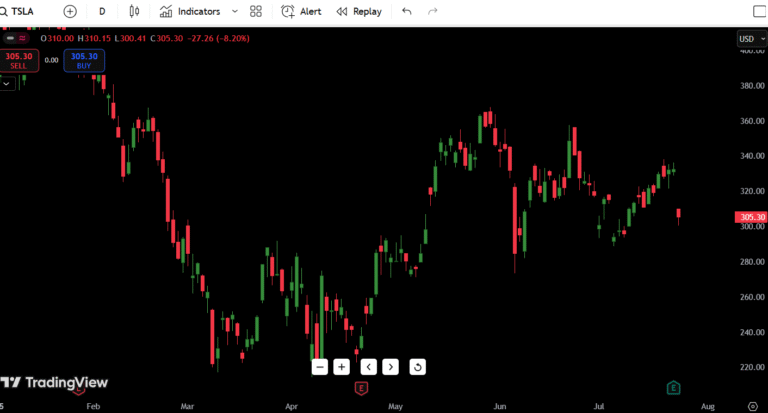
The daily TSLA chart shows a well-defined short-term uptrend that began in early July after price bottomed around $271. Since then, we’ve seen a classic stair-step pattern of higher highs and higher lows, ideal for bullish continuation.
Recent Technical Observations:
- Trend: Strong bullish momentum since July 5
- Candlestick Formations:
- Bullish engulfing (July 5) kicked off the rally
- Inside bar breakout (July 15–16) confirmed uptrend
- July 23 candle shows conviction: higher high + higher close
- Volume Behavior:
- Volume was declining during the June dip
- Bullish candles in July are now accompanied by increasing volume, indicating institutional interest returning
- Market Structure Shift:
- Clear reversal off demand near $271
- Break above $322 confirmed swing low structure
- Price is approaching supply near $336–343 — a potential breakout zone
This price action structure is typical of a controlled accumulation cycle following a correction. As long as TSLA holds above $322–326, the uptrend remains intact. Break and hold above $343.50, and we may see a retest of $360+.
TSLA Support and Resistance Levels Table
| Type | Price Level | Description |
|---|---|---|
| Resistance 1 | $336.00 | Local resistance zone (swing high) |
| Resistance 2 | $343.50 | Breakout trigger + prior top wick |
| Resistance 3 | $360.00 | Late May swing high |
| Resistance 4 | $384.29 | 52-week high |
| Support 1 | $322.00 | Key short-term higher low |
| Support 2 | $310.00 | Prior breakout and demand zone |
| Support 3 | $296.00 | Volume shelf and psychological |
| Support 4 | $271.00 | July low and reversal base |
Bolded Level Focus: Watch $336.00. If TSLA breaks and closes above this with volume, we could see a swift move to $343.50–$360.
7-Day Price Forecast Table – TSLA Outlook
| Date | High | Low | Expected Close |
|---|---|---|---|
| Day 1 (Jul 24) | $336.50 | $328.00 | $333.50 |
| Day 2 (Jul 25) | $340.00 | $330.50 | $338.25 |
| Day 3 (Jul 26) | $343.50 | $334.00 | $342.75 |
| Day 4 (Jul 27) | $346.00 | $338.50 | $344.00 |
| Day 5 (Jul 28) | $351.00 | $340.00 | $348.50 |
| Day 6 (Jul 29) | $355.00 | $343.00 | $353.00 |
| Day 7 (Jul 30) | $360.00 | $345.50 | $356.25 |
Forecast Logic:
If Tesla continues to print higher lows while holding above $322, the path of least resistance points toward $343.50, then $360. The critical zone to watch is the breakout attempt near $336. A rejection at $343 could cause a pullback to $310–$315 before any new leg higher.
Buy, Hold, or Sell Decision Table
| Action | Trigger Condition | Reasoning |
|---|---|---|
| BUY | Close above $343.50 | Breakout confirmation with volume |
| HOLD | Between $322–$343 | Bullish range – wait for breakout |
| SELL | Break below $310.00 | Breakdown below demand and trend |
Trade Strategy Discussion:
At current levels, TSLA offers a solid risk/reward for active swing traders. Here’s how I’d approach it:
- Buy on Breakout: A confirmed close above $343.50 with volume = long entry. Target: $360–$384.
- Hold: If price consolidates between $322–$336, patience is key. This zone is the coil before the spring.
- Sell or Avoid: A break and close below $310.00 suggests failed bullish structure. In that case, TSLA may revisit $296 or even $271.
In short: Only get aggressive on long trades above $343 — until then, manage risk with tighter stops.
Fundamental Triggers – What Could Move TSLA Next?
While the chart paints a bullish picture, macro and company-specific catalysts can add fuel (or fear):
Upcoming Earnings:
- Earnings Date: Expected around July 30, 2025
- Expect high volatility the week of earnings — either a breakout or bull trap could occur
Macro Triggers:
- Fed’s July statement (possible rate cut pause or dovish tone could lift growth stocks)
- Energy/EV sector flows — watch how peers like RIVN, NIO, and F trade
Analyst Sentiment:
- Recent upgrades by Morgan Stanley and Wedbush in early July sparked a bullish reversal
- Institutional accumulation is visible in volume profiles
Final Thoughts – TSLA Stock Forecast & Outlook
Overall, Tesla (TSLA) is showing strong signs of bullish continuation after reclaiming control of its trend from the $271 low.
Bullish Setup Highlights:
- Trend: Higher highs + higher lows
- Breakout watch: $336–$343.50 zone
- RSI not overheated (based on context)
- Volume building on green days = strength
Risks to Watch:
- Earnings whipsaw volatility
- Market-wide pullbacks
- Rejection at resistance = fakeout trap
In my experience, these tight channel trends after bottoming can be deceptive — if bulls don’t follow through above $343.50 soon, expect a pullback trap to shake out weak hands before any real continuation.

