Amazon (AMZN) Stock Analysis – July 23, 2025
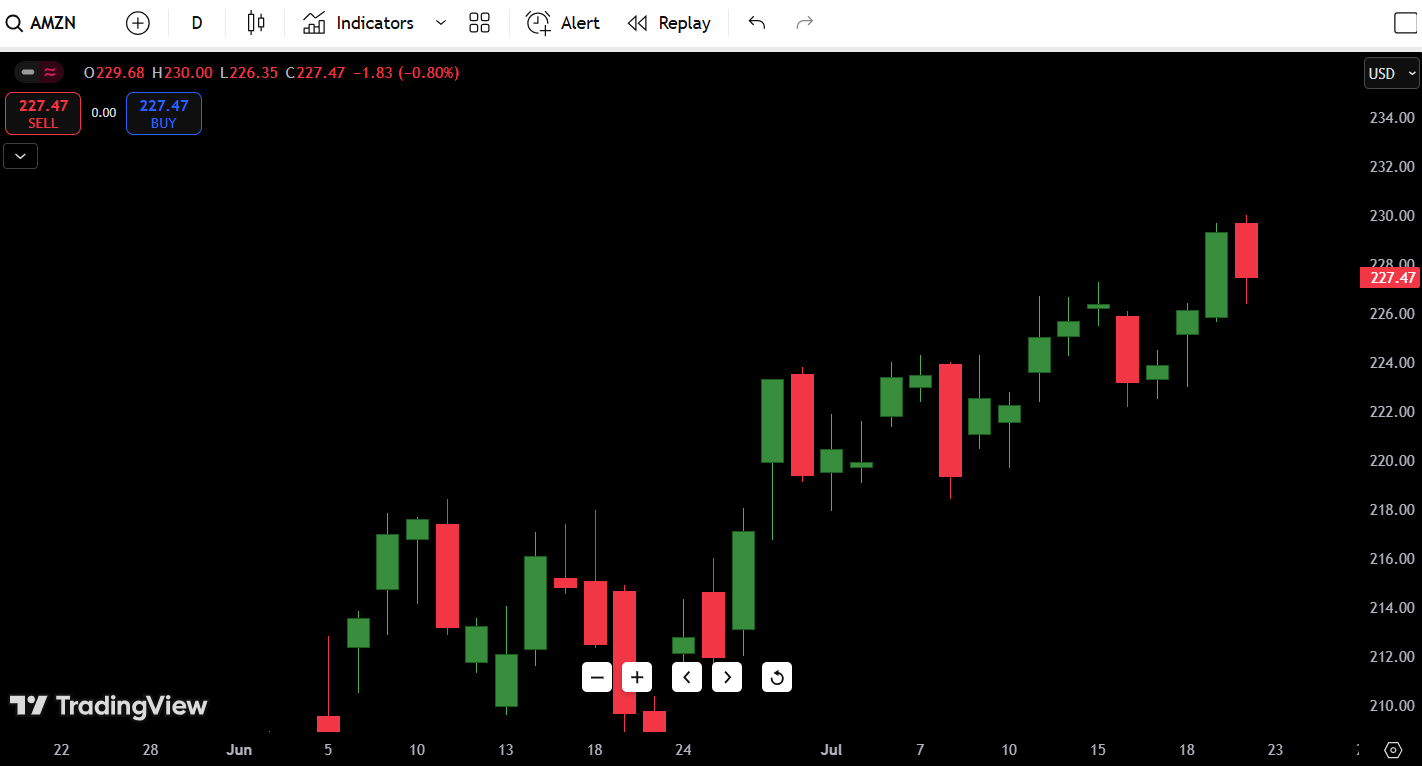
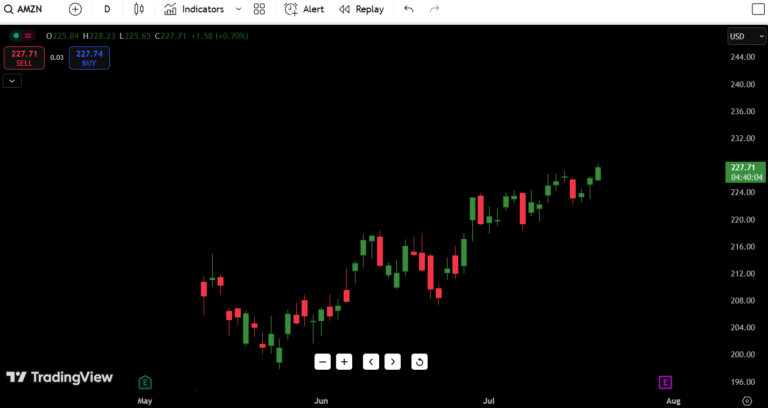
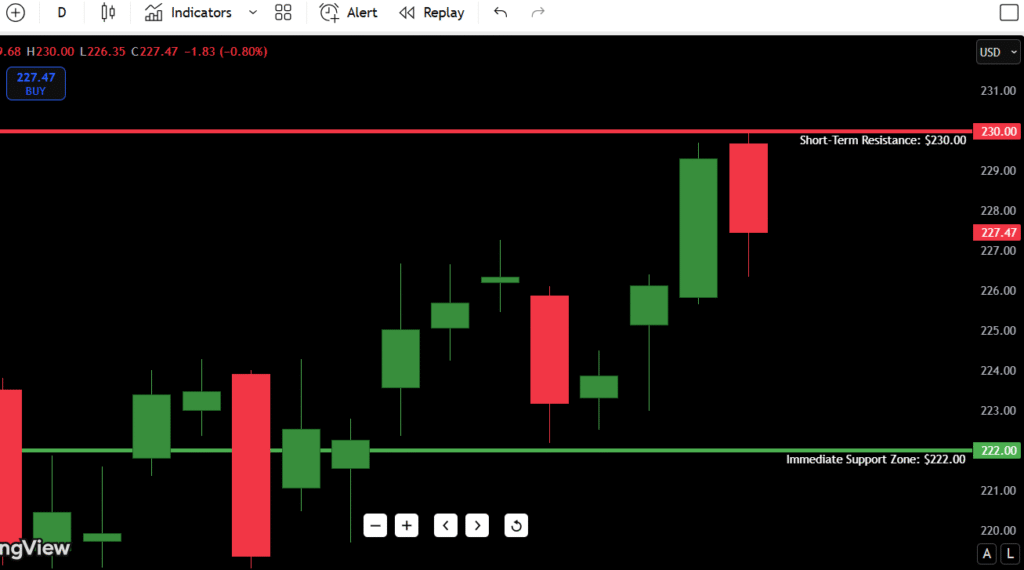
As of July 23, 2025, Amazon stock price today is $227.47, down 0.80% on the day after hitting $230.00 and fading back into support. It’s the second time this month that AMZN has tapped that zone and failed to follow through.
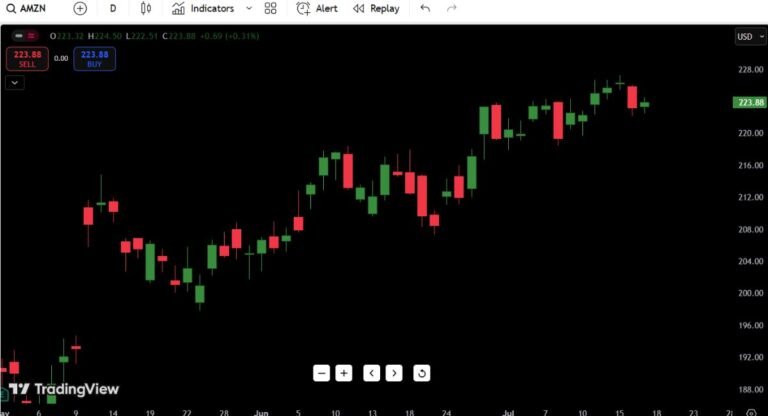
The price action today is mildly bearish, printing a red daily candle with a long wick—often a sign of buying exhaustion or distribution. Traders eyeing the Amazon candlestick chart should note that this recent stall comes after a steep run-up from mid-June, when the stock was trading near $188.50.
- Amazon stock price on July 23: $227.47
- 52-Week High: $233.84
- 52-Week Low: $118.35
- Short-Term Resistance: $230.00
- Immediate Support Zone: $222.00–$223.00
If Amazon can reclaim and close above $230, we could see an aggressive continuation to retest its 52-week high. But a failure to hold above $222.00 could spark a short-term correction toward the $216–$217 support cluster.
Contents
- Candlestick Chart Analysis: Price Action Breakdown
- 🔸 Uptrend Confirmed… But Slowing
- 🔸 Today’s Candle: Bearish Rejection
- 🔸 Volume and Volatility
- 🔸 Watch This Pattern
- Support and Resistance Levels Amazon
- 🔍 Key Zone to Watch: $222.00
- 4. 7-Day Price Forecast for AMZN
- 📈 Forecast Logic:
- 5. Buy, Hold, or Sell Decision Table
- 🧠 Trade Strategy Insight:
- 6. Fundamental Triggers to Watch
- 🧾 Earnings Report – Early August
- 📉 Fed Decision & Interest Rate Volatility
- 📦 E-Commerce Macro Trends
- 💰 Institutional Rotation
- 7. Final Thoughts: Trade Setup and Risk Zones
- 🎯 Outlook: Cautiously Bullish
- 🧭 Key Levels:
- 🧠 Trader Insight:
Candlestick Chart Analysis: Price Action Breakdown
The Amazon candlestick chart as of July 23 shows a textbook example of a stock entering a stall phase after a sharp rally.
Let’s walk through the price action like a trader:
🔸 Uptrend Confirmed… But Slowing
Amazon has printed a clean series of higher highs and higher lows since bottoming in mid-June around $188.50. However, momentum appears to be stalling just under $230—a level that’s now acted as resistance twice in July.
🔸 Today’s Candle: Bearish Rejection
- Candle: July 23 shows a long upper wick and red close — a classic rejection candle
- Price Action: High of day was $230.00, but sellers drove it back to close at $227.47
- Structure: This is a possible lower high intraday, which could shift momentum in the short term
🔸 Volume and Volatility
While volume isn’t visible on this screenshot, the price behavior implies supply at $230. Multiple candles in recent sessions show upper wicks near this level — indicating that sellers are stepping in early and demand is weakening near highs.
🔸 Watch This Pattern
If Amazon puts in another red day tomorrow, we could see a short-term swing high form. That could trigger a mean reversion move toward the rising support around $222–$223 — or even deeper into the $216–$217 zone, which was a prior breakout level.
Support and Resistance Levels Amazon
Here are the major levels to watch, based on recent structure:
| Type | Price Level | Description |
|---|---|---|
| Resistance 1 | $230.00 | Rejected July 23 – major ceiling |
| Resistance 2 | $233.84 | 52-week high |
| Resistance 3 | $238.00 | Measured move breakout target |
| Resistance 4 | $245.00 | Psychological round number target |
| Support 1 | $222.00 | Recent higher low and base |
| Support 2 | $216.50 | Bullish breakout retest zone |
| Support 3 | $211.00 | June 28 pullback low |
| Support 4 | $188.50 | June swing low – major support |
🔍 Key Zone to Watch: $222.00
This is the pivot level for short-term sentiment. Hold above, and bulls stay in control. Lose this zone, and momentum could unwind quickly.
4. 7-Day Price Forecast for AMZN
Here’s what the next 7 trading days may look like, based on structure and volatility expectations:
| Date | High | Low | Expected Close |
|---|---|---|---|
| July 24 | $229.50 | $223.50 | $225.00 |
| July 25 | $228.00 | $221.50 | $222.70 |
| July 26 | $226.00 | $219.50 | $221.30 |
| July 27 | $224.00 | $218.00 | $219.00 |
| July 28 | $223.00 | $216.00 | $217.50 |
| July 29 | $221.00 | $215.50 | $219.20 |
| July 30 | $224.00 | $218.00 | $221.80 |
📈 Forecast Logic:
If AMZN can hold above $222 into midweek, we could see consolidation followed by a fresh breakout test toward $230. But if we see two red daily closes, odds increase for a flush toward $216–$217, which would still be within the uptrend — just a deeper pullback.
5. Buy, Hold, or Sell Decision Table
| Action | Trigger Condition | Reasoning |
|---|---|---|
| BUY | Close above $230.00 | Clean breakout with confirmation |
| HOLD | Range between $222–$230 | Consolidation, no clear direction |
| SELL | Close below $222.00 | Breakdown of short-term structure |
🧠 Trade Strategy Insight:
Buy:
Traders looking for a breakout entry should wait for a daily close above $230.00 with follow-through. A breakout above this zone could target $233.84 quickly and even $238–$240 in a squeeze.
Hold:
If AMZN continues to grind between $222 and $230, this is a no-trade zone for trend followers. Let price commit to a direction.
Sell:
A break and close below $222.00 would confirm the current high as a short-term top. That opens the door to a pullback into $216.50, or even $211.00, where buyers are likely to reload.
6. Fundamental Triggers to Watch
While the technicals are clearly defined, here are upcoming macro and micro catalysts that could sway Amazon stock:
🧾 Earnings Report – Early August
- Analysts will focus on AWS revenue growth, ad revenue, and margins.
- Guidance will be key. Any softness on consumer strength or logistics efficiency could weigh heavily on valuation.
📉 Fed Decision & Interest Rate Volatility
- If the Fed signals continued hawkishness, tech/growth names like AMZN could face pressure.
- On the flip side, any hint at rate cuts in Q4 would be rocket fuel for Amazon’s valuation.
📦 E-Commerce Macro Trends
- Amazon is a bellwether for global e-commerce. A slowdown in consumer spending (e.g., weaker retail sales) may hurt AMZN sentiment in the short term.
💰 Institutional Rotation
- Watch fund flows into tech vs cyclicals. A shift out of mega-cap tech into energy or financials could drag AMZN, regardless of individual strength.
7. Final Thoughts: Trade Setup and Risk Zones
Amazon is at a make-or-break level. After a powerful rally off the $188.50 base, the stock is now stalling just beneath key resistance at $230.00.
🎯 Outlook: Cautiously Bullish
- Structure still supports higher prices
- But today’s rejection candle signals potential short-term weakness
🧭 Key Levels:
- Bullish Breakout Trigger: Close above $230.00
- Bearish Breakdown Trigger: Close below $222.00
🧠 Trader Insight:
“In my experience, when a stock prints multiple rejection candles near resistance—like AMZN has at $230—it often means smart money is unloading into late buyers. I’m not touching this long unless we get a clean breakout above $230 with volume. Otherwise, I’m watching for a fade back to $216–$217 with a tight stop.”
If you’re a short-term trader, this is a high-risk, low-reward zone until a breakout or breakdown confirms. Stay patient and let price show its hand.

