Microsoft (MSFT) Stock Analysis – July 23, 2025: Buy or Bail?
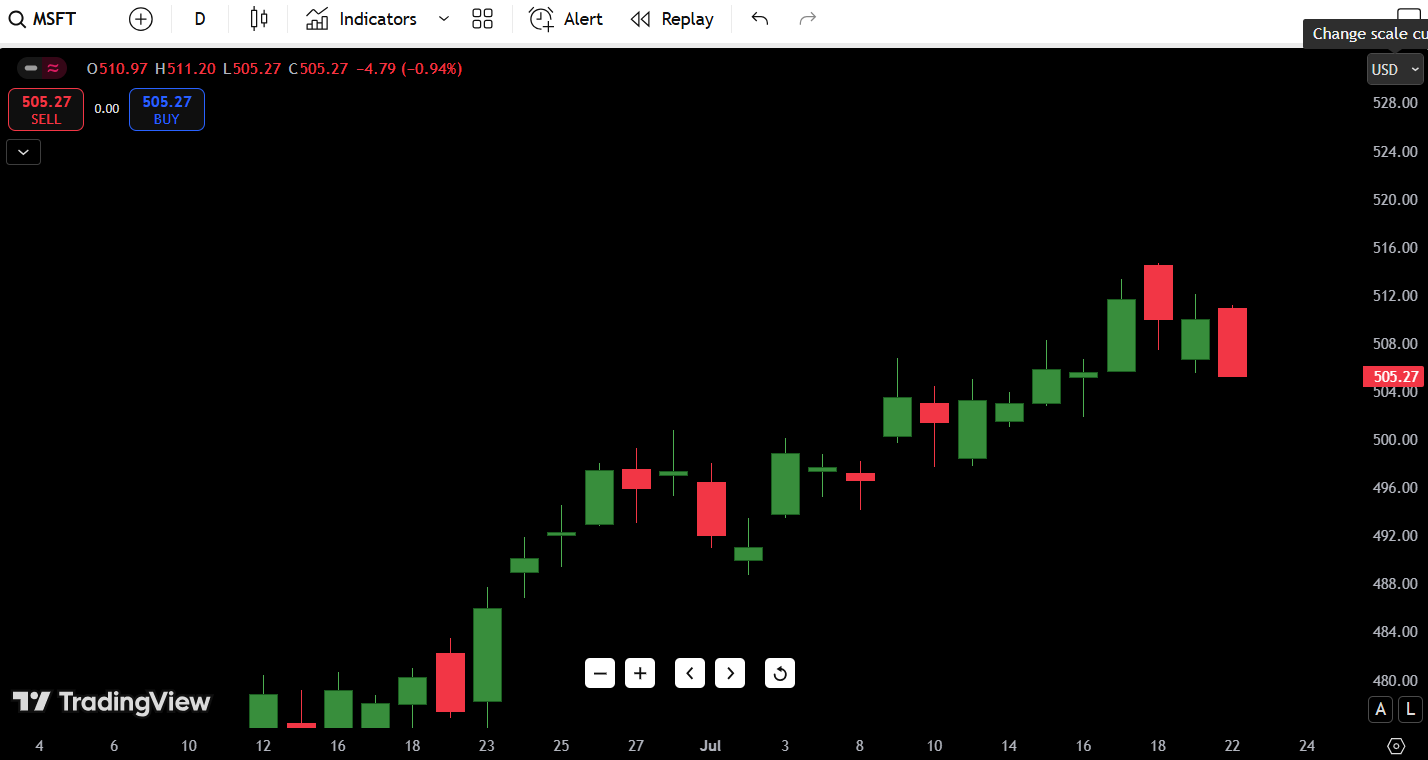
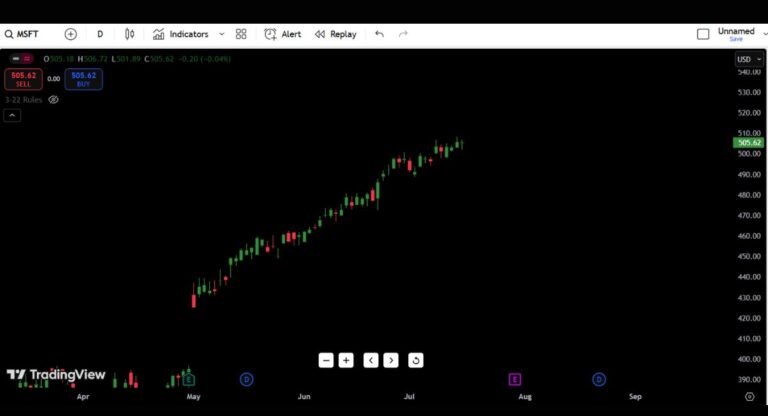
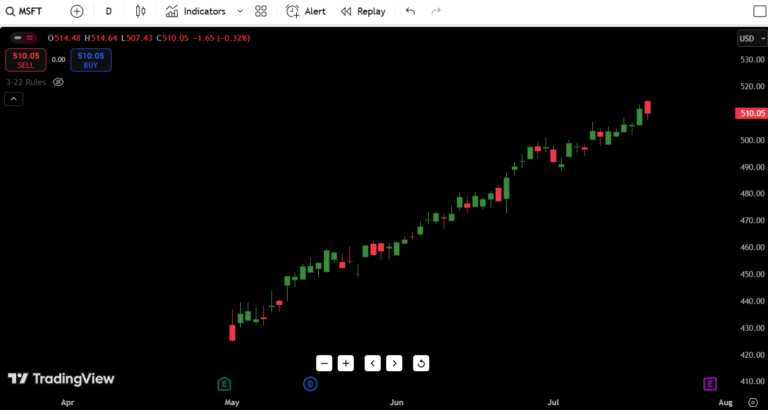
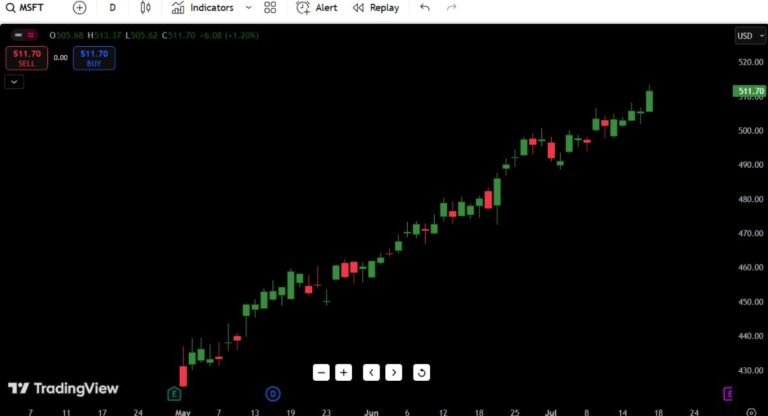
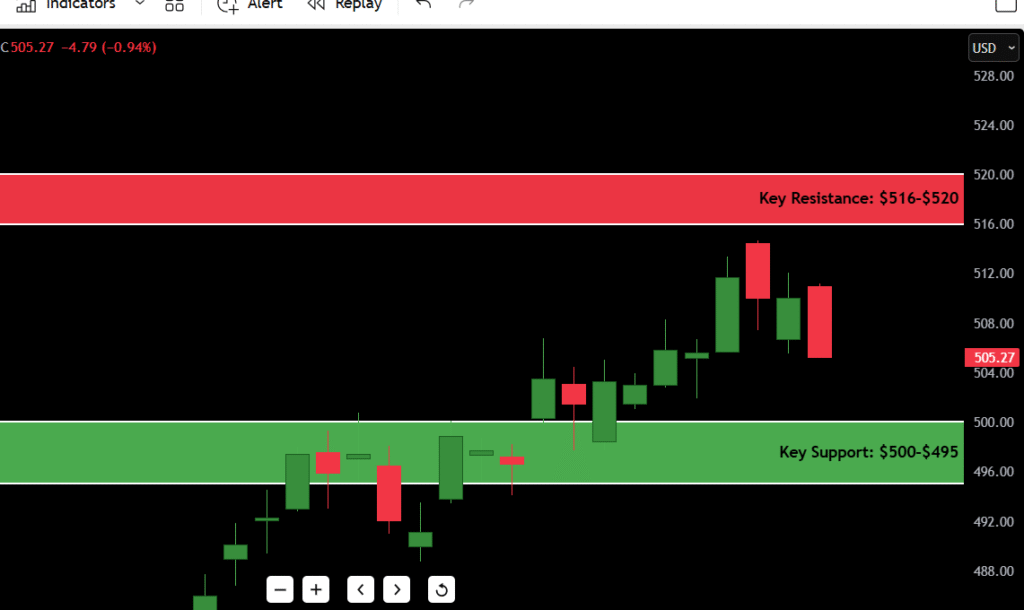
As of July 23, 2025, Microsoft ($MSFT) stock is trading at $505.27, closing the day down 0.94% with a loss of $4.79. The daily candlestick printed a strong bearish bar, rejecting from a recent high of $516.20 and closing right at the day’s low.
This kind of price action often raises eyebrows among short-term traders looking for a potential pullback setup or trend exhaustion signal.
Here’s where things stand:
- Microsoft stock price on July 23 $505.27
- Daily Trend: Cautiously Bullish, but fading momentum
- 52-Week High / Low: $522.50 / $309.45
- Key Resistance: $516–$520
- Key Support: $500–$495
- Today’s MSFT Forecast: Bearish to Neutral Bias
The recent rally off June lows has been impressive, but today’s red candle near the highs signals short-term weakness — possibly the start of a retest or cooling-off period.
Contents
- Microsoft Candlestick Chart Analysis
- ✅ Overall Trend:
- ⚠️ Bearish Candle Alert (July 23):
- 📉 Volume Context (if available):
- 🧠 Market Psychology:
- MSFT Support and Resistance Levels Table
- 7-Day MSFT Stock Forecast Table
- Forecast Logic:
- Buy, Hold, or Sell Decision Table
- 🟢 If You’re Long
- 🔴 If You’re Short or Bearish
- Fundamental Triggers to Watch
- Final Thoughts on Microsoft Stock
- 💡 My Personal Trading Insight:
- ✅ Outlook: Cautiously Bullish – Watch $500 Closely
Microsoft Candlestick Chart Analysis
Zooming into Microsoft’s candlestick chart reveals some important technical nuances:
✅ Overall Trend:
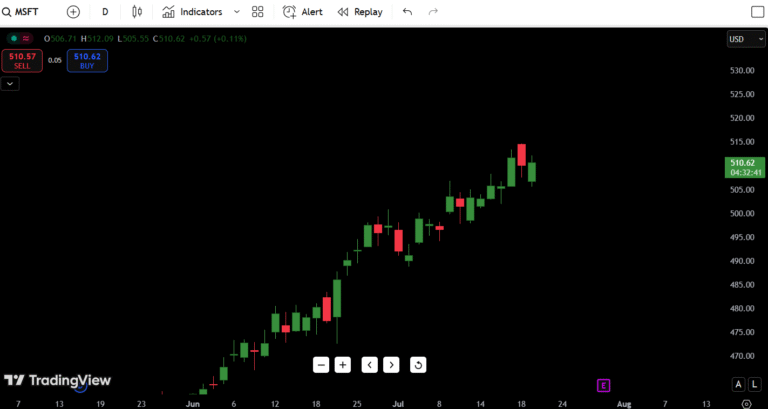
MSFT remains in a well-structured uptrend, with higher highs and higher lows since mid-June. However, the last few sessions have shown reduced momentum as price approaches resistance near $516.
⚠️ Bearish Candle Alert (July 23):
Today’s candle is a full-bodied red bar that opened near the high and closed at the low ($505.27), erasing gains from prior sessions. There’s no lower wick, which often suggests strong selling into the close — a bearish short-term signal.
📉 Volume Context (if available):
While not shown directly in the chart, candles like today’s are usually accompanied by above-average volume, reflecting profit-taking or short-term bearish bets entering the tape.
🧠 Market Psychology:
This candle resembles a mini-climax top near prior resistance. Many traders will view this as a cue to lighten up or prepare for a dip toward support zones around $500.
MSFT Support and Resistance Levels Table
| Type | Price Level | Description |
|---|---|---|
| Resistance 1 | $516.20 | Recent daily high |
| Resistance 2 | $520.00 | Round-number psychological zone |
| Resistance 3 | $522.50 | 52-week high |
| Resistance 4 | $530.00 | Potential breakout target |
| Support 1 | $500.00 | Key round number and near-term support |
| Support 2 | $495.50 | Minor base from late June |
| Support 3 | $485.00 | Demand zone tested July 1–3 |
| Support 4 | $470.00 | Strong swing low + 50-day MA zone |
➡️ $500 is the most critical short-term level. A breakdown below this zone could invite fast selling toward $495 or even $485.
7-Day MSFT Stock Forecast Table
Based on price structure, momentum, and historical behavior near these zones, here’s a short-term projection for MSFT:
| Date | High | Low | Expected Close |
|---|---|---|---|
| July 24 | $510.50 | $500.10 | $503.80 |
| July 25 | $508.00 | $498.00 | $500.50 |
| July 26 | $505.50 | $493.80 | $496.30 |
| July 27 | $498.50 | $490.00 | $492.00 |
| July 28 | $500.50 | $488.50 | $495.70 |
| July 29 | $505.00 | $493.00 | $501.00 |
| July 30 | $508.50 | $500.00 | $507.20 |
Forecast Logic:
If Microsoft fails to hold the $500 level, we may see a controlled pullback toward $493–$495, where prior buyers could re-enter. Any bounce above $507+ would suggest the dip was healthy and may continue the trend.
Buy, Hold, or Sell Decision Table
| Action | Trigger Condition | Reasoning |
|---|---|---|
| BUY | Daily close above $516 | Breakout from resistance + continuation |
| HOLD | Between $500–$516 | Sideways chop inside consolidation zone |
| SELL | Break below $500 | Loss of support, short-term breakdown |
🟢 If You’re Long
You want to see MSFT bounce cleanly off $500 with bullish candles and tight risk. A strong green candle reclaiming $510+ would confirm the uptrend is alive.
🔴 If You’re Short or Bearish
Your ideal entry is a daily close below $500, targeting a move to $495, then $485. This would also break the recent rising structure.
Fundamental Triggers to Watch
While this analysis is primarily technical, Microsoft is always subject to macro and company-specific catalysts:
- Earnings Date: Expected late July (exact date TBD) – volatility risk!
- Nvidia/Azure Cloud Ecosystem Correlation: If AI hype cools, MSFT may retrace
- Rate Policy: Any hawkish Fed surprise could hurt growth stock momentum
- Analyst Coverage: Watch for price target hikes/downgrades as we approach earnings
Also keep an eye on the broader Nasdaq and Big Tech sentiment, which heavily influence MSFT’s directional behavior.
Final Thoughts on Microsoft Stock
Microsoft ($MSFT) is technically strong and fundamentally dominant, but today’s candlestick may be signaling a healthy pause or short-term pullback.
💡 My Personal Trading Insight:
“In my experience, when a stock prints a full red candle at the top of a multi-week rally, it’s rarely random. It often signals temporary exhaustion — especially when the close is at the day’s low. I’ll be watching the $500–$495 zone closely for a bounce or a breakdown.”
✅ Outlook: Cautiously Bullish – Watch $500 Closely
- Above $516 = Re-acceleration to $522+
- Below $500 = Short-term weakness toward $485
- Neutral in Range = Patience game, wait for confirmation

