Microsoft (MSFT) Stock Analysis – July 24, 2025: Buy or Bail?
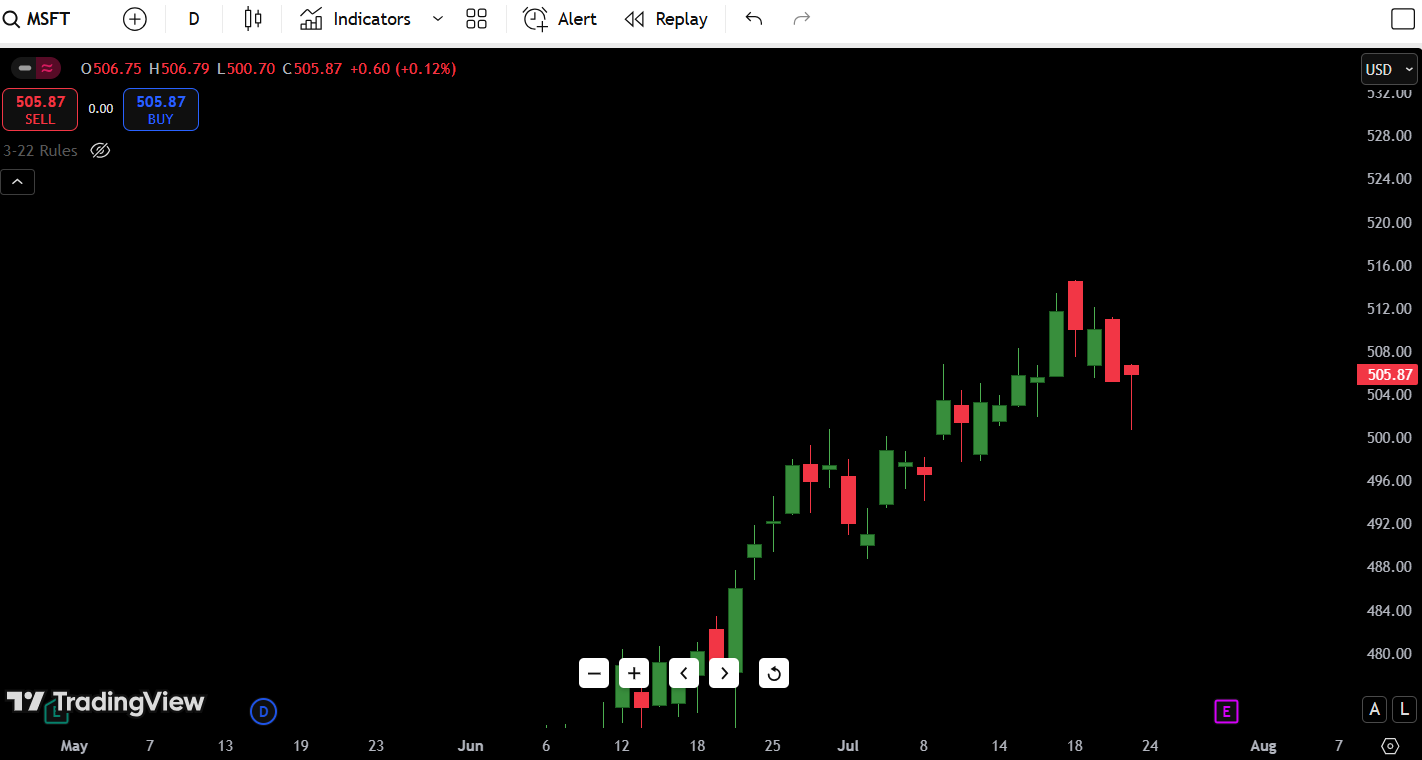
As of July 24, 2025, Microsoft (MSFT) stock is trading at $505.87, marginally up +0.12% for the day. After opening at $506.75, MSFT tested a low of $500.70 before climbing back to close near the open. The daily candle reflects indecision, sitting right at a potential short-term pivot zone.
- MSFT Stock Price Today: $505.87
- July 24 Forecast: Neutral to Slightly Bullish
- 52-Week High: ~$528.10
- 52-Week Low: ~$382.10
- Key Resistance Zone: $512 – $516
- Critical Support Zone: $496 – $500
Key Observation: After a near-parabolic run from late June, Microsoft is now pulling back into a prior breakout zone. If it holds here, this could offer a fresh entry on a trend continuation. If not, the next few sessions may test deeper support.
Read my Previous Microsoft Stock Analysis – July 23, 2025
Contents
Candlestick Chart Analysis: MSFT Price Action Today
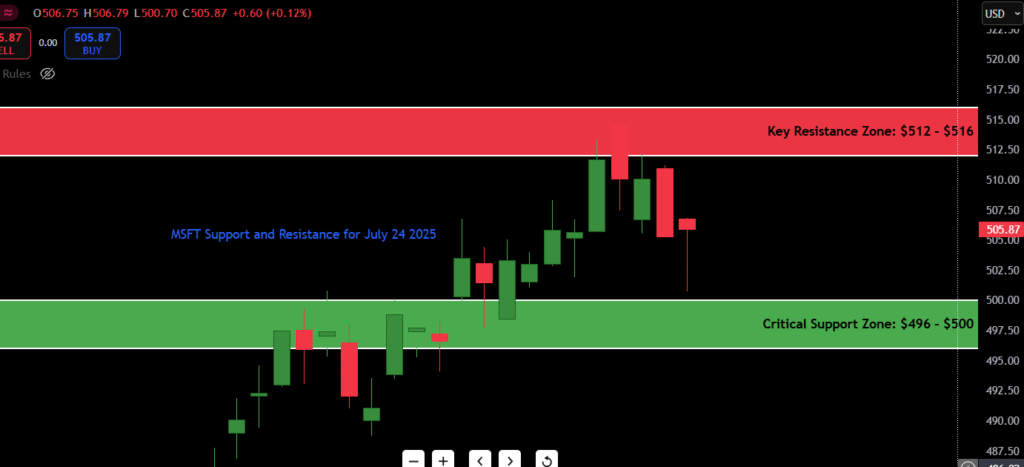
The MSFT candlestick chart is showing a clear narrative momentum has slowed, but the trend is still technically intact.
Trend and Structure
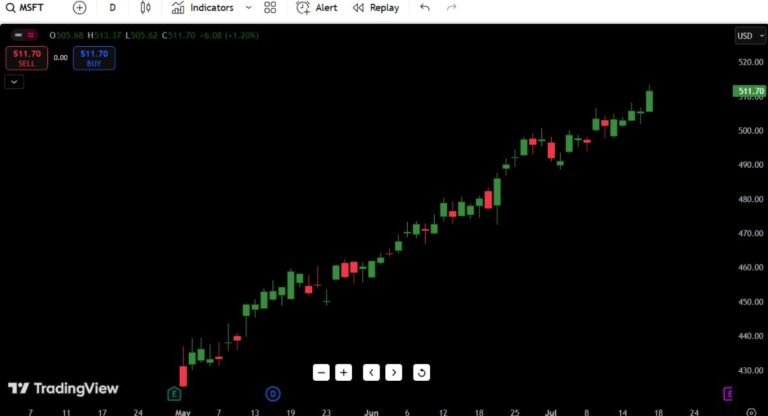
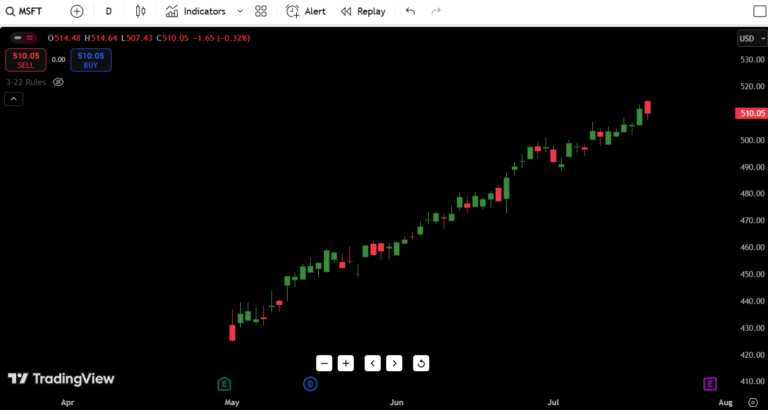
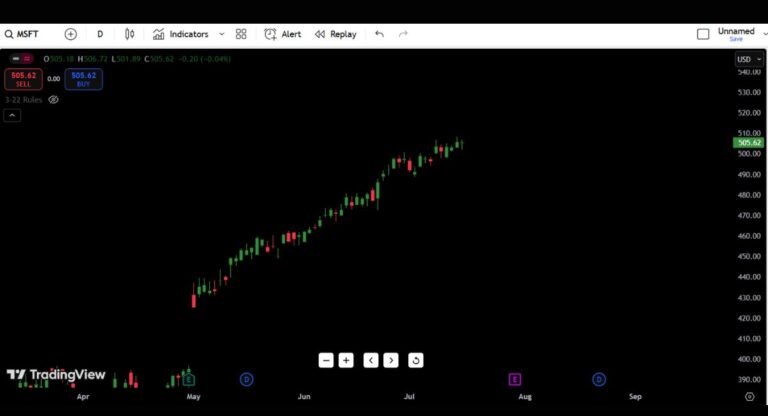
- Microsoft remains in a medium-term uptrend, making a series of higher highs and higher lows since mid-June.
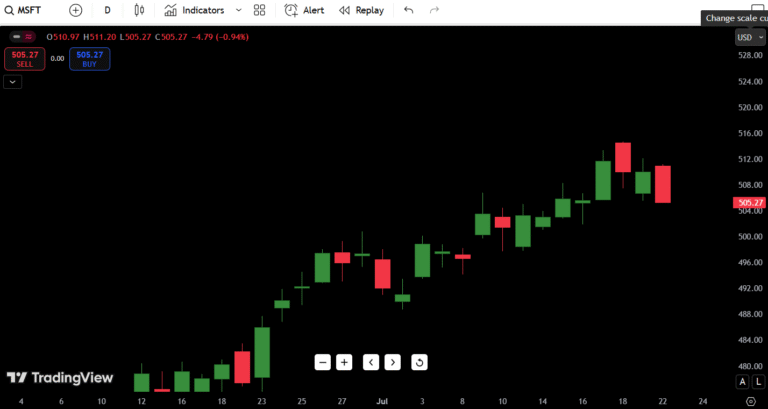
- The recent surge began from the $438 breakout base and peaked near $516.30, where the latest rejection occurred.
Recent Candlestick Behavior
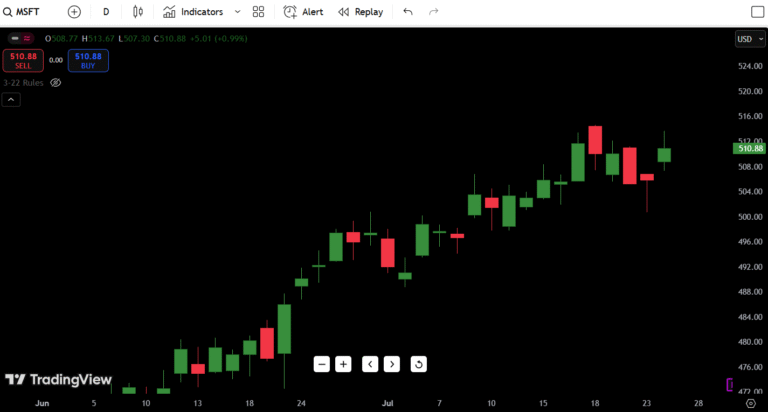
- The last three candles form a bearish mini-pullback pattern:
- July 22: Rejection wick from highs
- July 23: Full red body closing near the low
- July 24: Small-bodied candle with a long lower wick — a potential hammer, signaling buying interest near $500
This is the kind of micro pullback you’d expect in a strong trend — not yet a full reversal.
Volume & Momentum Signals
- Volume has started to contract slightly — typical in a resting phase after a breakout.
- While there’s no visible RSI or MACD on the chart, the price structure alone suggests overextension cooling, not breakdown.
Market Structure Insight
- The recent rejection from $516 was not violent — it appears more like a healthy retest and digestion of gains.
- If bulls reclaim $510+, expect renewed upside momentum.
- A breakdown below $496 would shift sentiment more bearish short-term.
MSFT Support and Resistance Levels Table
| Type | Price Level | Description |
|---|---|---|
| Resistance 1 | $512.00 | Recent daily swing high |
| Resistance 2 | $516.30 | Last breakout peak |
| Resistance 3 | $524.80 | Final barrier before ATH |
| Resistance 4 | $528.10 | 52-week high |
| Support 1 | $500.00 | Round number + demand wick |
| Support 2 | $496.00 | Key bounce area from July 16 |
| Support 3 | $488.50 | Breakout origin zone |
| Support 4 | $382.10 | 52-week low |
Most important level right now: $500.00 — a clean hold and bounce here signals continuation; a break below opens the door to $488–490 retest.
MSFT 7-Day Price Forecast Table
| Date | High | Low | Expected Close |
|---|---|---|---|
| Day 1 (Jul 25) | $510.20 | $500.50 | $508.00 |
| Day 2 (Jul 26) | $514.00 | $504.00 | $512.90 |
| Day 3 (Jul 27) | $518.20 | $508.00 | $516.10 |
| Day 4 (Jul 28) | $520.80 | $510.50 | $519.00 |
| Day 5 (Jul 29) | $523.50 | $514.00 | $521.80 |
| Day 6 (Jul 30) | $526.00 | $516.80 | $524.50 |
| Day 7 (Jul 31) | $529.00 | $520.20 | $527.80 |
Forecast Logic:
If MSFT holds above $500 with a strong bounce and buyers reclaim the $510–512 range, then a move back to $520+ becomes very likely by mid-week. Momentum has a history of returning quickly to large caps like Microsoft, especially in post-pullback phases.
On the flip side, a close below $496 would shift bias to downside, with $488–490 coming into play as the next demand zone.
Buy, Hold, or Sell Decision Table
| Action | Trigger Condition | Reasoning |
|---|---|---|
| BUY | Close above $512.00 | Breakout continuation confirmed |
| HOLD | Range between $496–$512 | Neutral zone after pullback |
| SELL | Break below $496.00 | Breakdown from structure base |
Buy Setup:
A clean daily close above $512 would suggest that the recent pullback is complete and price is ready for another leg higher. This would align with the trend continuation thesis and offer strong risk/reward targeting $520–528.
Sell Trigger:
If MSFT breaks below $496 on high volume, it likely signals distribution and loss of trend structure. This could lead to a sharper correction toward the $488–490 area.
Fundamental Triggers to Watch for MSFT
Upcoming Earnings
- Microsoft’s Q2 earnings are scheduled for next week, and given the company’s strong cloud and AI narrative, traders are positioning ahead of it.
- Earnings surprise (positive or negative) will heavily affect momentum and trend continuation.
Fed Watch and Macroeconomic Factors
- Any rate policy changes or commentary on tech sector valuation from the Fed will move stocks like MSFT.
- Microsoft is sensitive to bond yields and macro growth signals, especially due to its large cloud and enterprise exposure.
Analyst Ratings & Revisions
- Most analysts maintain Buy or Overweight ratings, with price targets clustering around $550+.
- A surprise target hike or AI-driven segment growth forecast could ignite the next rally.
Institutional Accumulation
- Volume patterns suggest institutional interest remains strong — watch for block prints near the $500 zone which often precede sharp moves.
Final Thoughts: Where Does Microsoft Go From Here?
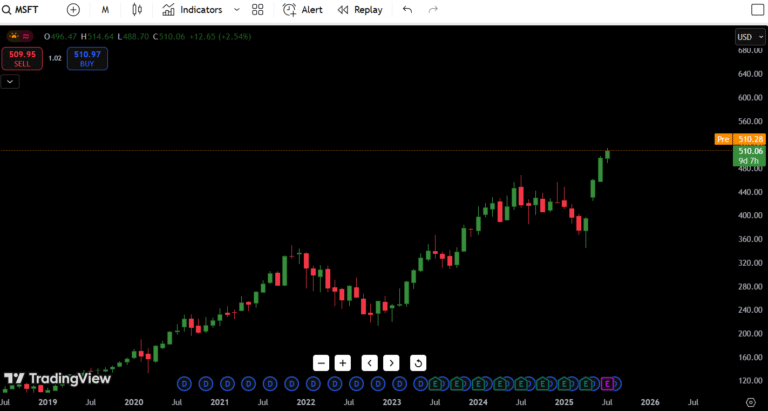
Microsoft remains one of the strongest tech charts of 2025 — and while it’s experiencing a short-term pullback, the uptrend remains firmly intact.
Outlook: Bullish with Caution
- Holding above $500 and reclaiming $512 confirms the continuation setup
- A break below $496 flips bias to short-term bearish
- Above $516, MSFT enters open air toward $528 ATH test
My Take as a Trader:
“This is a textbook bullish flag-type pullback after a strong run. If we get a clean reclaim of $512, I’m long toward $525+. But if price starts slipping under $496, I’ll let it go and look for a re-entry near $488–490. No need to be early in a momentum name like Microsoft — it usually gives you a second chance if you’re patient.”
Live Price Updates on TradingView

