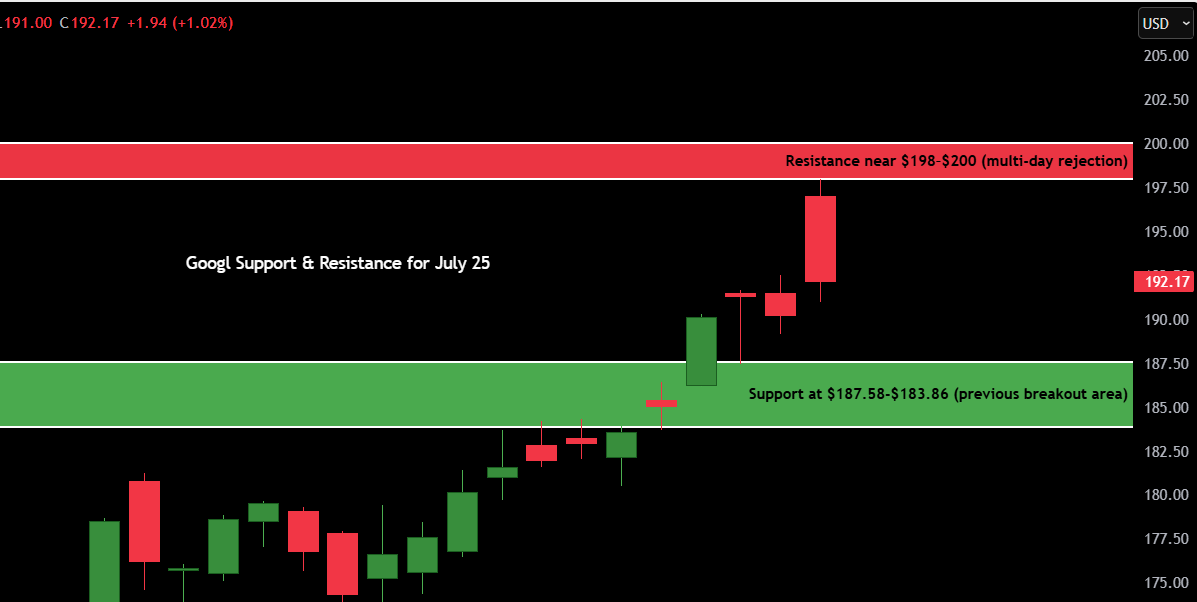
As of July 25, 2025, GOOGL stock is trading at $192.17, up 1.02% on the day after hitting an intraday high of $197.95. This marks a strong run from recent swing lows and has put the stock within striking distance of its 52-week high of $199.47. The 52-week low remains far below at $118.35, showing a monster recovery in 2025.
Today’s forecast: Leaning bullish, but flashing early caution signs.
What makes today’s price action important is the rejection wick near the $198 zone a possible sign of exhaustion after a strong short-term rally. Traders are watching if this move was a bullish breakout or a fakeout from the recent ascending channel.
Key zones to watch:
- Resistance near $198–$200 (multi-day rejection)
- Support at $187.58-$183.86 (previous breakout area)
Contents
Google Candlestick Chart Analysis

Zooming in on the recent daily candlestick chart:
Trend: GOOGL has been in a clear uptrend since bottoming around $166 in late June. Buyers have been stepping in consistently, forming higher highs and higher lows throughout July.
Recent Action: The stock saw an explosive move up from the $182–$184 range, breaking past near-term resistance last week and printing a large bullish candle on July 23 and 24. However, July 25’s candle shows early signs of a reversal — a long upper wick following a gap-up open that failed to hold intraday highs near $198.
That’s the kind of move that often shakes out breakout traders who enter late.
This could be a classic exhaustion candle, often referred to as a “buy climax”, especially when it’s unconfirmed by volume. If there’s no follow-through tomorrow, we could see a pullback toward the $188–$185 zone before bulls reload.
Chart Notes:
- The trend remains bullish, but momentum may be stalling near psychological resistance at $200.
- No clear reversal pattern yet, but volume divergence or a red candle tomorrow could confirm a short-term top.
- RSI (if visible) is likely approaching overbought territory, often a caution zone for momentum players.
Support and Resistance Levels Table
| Type | Price Level | Description |
|---|---|---|
| Resistance 1 | $198.00 | Intraday rejection zone |
| Resistance 2 | $200.00 | Psychological resistance |
| Resistance 3 | $199.47 | 52-week high |
| Resistance 4 | $204.00 | Gap-fill from April earnings |
| Support 1 | $188.50 | Breakout retest level |
| Support 2 | $184.25 | Last consolidation base |
| Support 3 | $179.75 | Key swing low from July 18 |
| Support 4 | $166.00 | Major demand, June low |
Bold levels are the most important zones. Watch $198 as a make-or-break area, and $188.50 as a potential buy-the-dip zone.
7-Day Price Forecast Table
| Date | High | Low | Expected Close |
|---|---|---|---|
| July 26 | $195.80 | $189.00 | $190.75 |
| July 27 | $194.25 | $187.20 | $189.50 |
| July 28 | $192.50 | $185.50 | $187.60 |
| July 29 | $190.00 | $183.25 | $184.75 |
| July 30 | $188.00 | $181.00 | $183.00 |
| July 31 | $186.50 | $180.25 | $181.75 |
| Aug 1 | $188.25 | $182.50 | $185.00 |
Forecast Logic:
If GOOGL fails to hold the $188.50 breakout zone in the next session, we could see a controlled pullback into the mid-$180s. But if buyers reclaim $195+ with volume, we’re back in breakout territory. Expect choppy action between $188–$198 before any clear direction.
Buy, Hold, or Sell Decision Table
| Action | Trigger Condition | Reasoning |
|---|---|---|
| BUY | Close above $198.25 | Fresh breakout above supply zone |
| HOLD | Range between $188–$197 | Consolidation, needs confirmation |
| SELL | Break below $185.50 | Failed breakout, downtrend risk |
Recommendation:
Right now, GOOGL is in a hold zone, hovering between resistance and support. If you’re long from lower, it’s worth letting it ride with a tight stop below $185.50. If you’re looking for new entries, be patient — wait for either a clean breakout over $198 or a pullback into the $182–$185 zone with bullish confirmation.
This isn’t the time to chase. The risk/reward setup will improve once one side wins.
Fundamental Triggers
Here’s what could shake up GOOGL’s technical picture:
- Q2 earnings are out, but post-earnings digestion is in play. Traders are now positioning for the second half of 2025.
- Ad spending recovery remains a bullish catalyst. Google’s cloud and AI growth also keep the stock attractive on dips.
- Interest rate decisions from the Fed and macro commentary could trigger sector-wide volatility, especially in tech.
- Institutional inflows have been supportive this month. A drop in volume may signal they’re stepping away — which would align with a pullback.
If the broader market rolls over, GOOGL will likely follow.
Final Thoughts
The technical setup on GOOGL stock heading into August is a classic test of momentum.
- Outlook: Cautiously bullish, but not a spot to be aggressive.
- Watch for: Rejection at $198 turning into a fade toward $185.
- Invalidation point: Break and close below $184 — that would break structure.
- Confirmation for bulls: Strong close above $198.25 with expanding volume.
In my experience, extended runs like this without base building tend to retrace before continuing higher. If price keeps stalling under $198 and we see a red daily candle with volume, I’ll be watching for a fade back to the $184–$185 demand zone, where risk/reward favors dip buying.
But if bulls push through and we get a clean breakout above $198, then it’s game on — next upside target would be $204 (gap-fill zone).
Stay nimble. Don’t chase strength blindly — let the chart do the talking.
