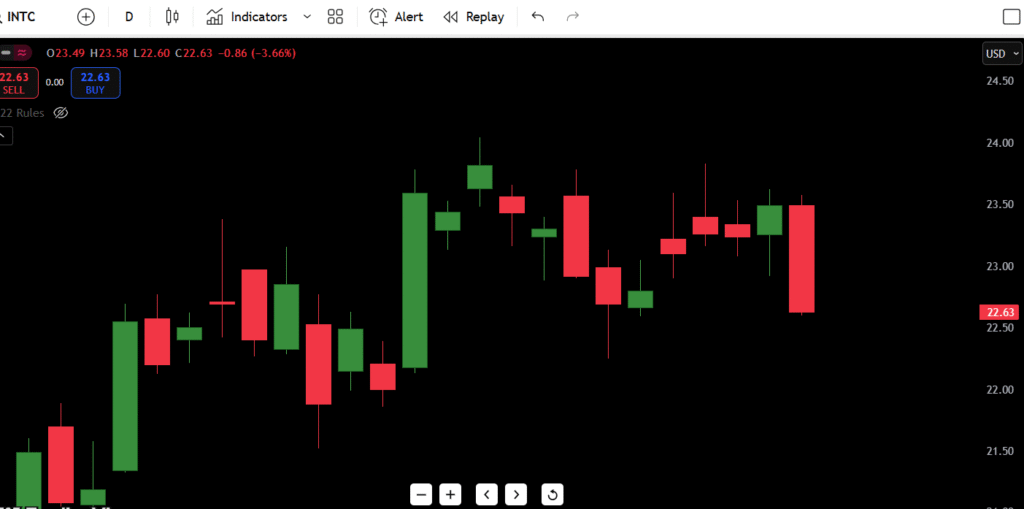
As of today, Intel Corporation (NASDAQ: INTC) is trading at $22.63, down sharply by 3.66% on the day. This marks a clear bearish shift after failing to hold above short-term support near $23.50. INTC is now down over 25% from its recent peak of $30.10, putting pressure on bulls as we head deeper into earnings season.
The 52-week high sits at $45.34, while the 52-week low is $21.53. We are now hovering dangerously close to that low, and if the price breaks beneath the $22.00–$22.20 zone, it could open the gates for further downside toward multi-year support.
The most critical levels today include a resistance band around $23.80–$24.10, and immediate support at $22.00. Price action is beginning to look heavy, and unless buyers step in with volume, INTC may revisit its 2024 lows.
Contents
Intel (INTC) price July 25, 2025 Graph

Candlestick Chart Analysis
INTC’s current chart shows a short-term topping structure after a decent run-up from its June lows near $19.50. The recent trend had been mildly bullish, but that momentum has now stalled out in the past week.
Let’s break down today’s action and what it means for traders:
- Today’s candle is a strong red bar, closing at $22.63 after an intraday high of $23.58 and a low of $22.60. The upper wick signals that bulls tried to push but failed—indicating clear selling pressure at higher levels.
- This rejection at the $23.50–$23.80 zone aligns with previous resistance and could now act as a strong supply zone going forward.
- Volume (not visible here) is likely rising on the red day, confirming that this drop isn’t just a quiet retracement—it’s a volume-backed breakdown.
- The structure resembles a failed breakout followed by a liquidity sweep, where price sucked in late longs and flushed them out. Classic bull trap.
- INTC also failed to break cleanly above the June swing highs, creating a lower high on the larger time frame—another bearish technical signal.
If bulls want to regain control, they need to reclaim $23.80 quickly, or this pullback may deepen into a multi-week downtrend.
INTC Support and Resistance Levels Table
| Type | Price Level | Description |
|---|---|---|
| Resistance 1 | $23.80 | Recent swing rejection point |
| Resistance 2 | $24.30 | Pre-breakdown consolidation top |
| Resistance 3 | $25.00 | Breakdown zone from earlier range |
| Resistance 4 | $26.90 | Gap-fill target from April |
| Support 1 | $22.00 | Key demand and psychological level |
| Support 2 | $21.53 | 52-week low |
| Support 3 | $20.85 | March 2024 bottom |
| Support 4 | $19.60 | June 2024 bottom |
$22.00 is the most important level to watch—if that fails, things could unravel quickly toward the 52-week low at $21.53.
Intel (INTC) Stock Price History & Forecast: Next 7 Days
| Date | High | Low | Expected Close |
|---|---|---|---|
| Day 1 (Jul 26) | $23.10 | $22.10 | $22.45 |
| Day 2 (Jul 27) | $22.70 | $21.60 | $21.95 |
| Day 3 (Jul 28) | $22.40 | $21.40 | $21.80 |
| Day 4 (Jul 29) | $22.20 | $21.30 | $21.60 |
| Day 5 (Jul 30) | $22.50 | $21.80 | $22.10 |
| Day 6 (Jul 31) | $22.90 | $22.10 | $22.40 |
| Day 7 (Aug 1) | $23.20 | $22.40 | $22.95 |
Forecast logic: Unless INTC defends $22.00 with strong buyer volume, the price may dip below $21.50 by mid-week. We might see a dead cat bounce attempt around Thursday, but if that fails, lower lows are likely. A surprise reclaim of $23.80 would flip the script back to bullish.
INTC Stock – Buy, Hold, or Sell Today?
| Action | Trigger Condition | Reasoning |
|---|---|---|
| BUY | Close above $23.80 | Breakout confirmed, shift in trend |
| HOLD | Between $22.00–$23.80 | Sideways chop, indecision zone |
| SELL | Break below $22.00 | Breakdown of key support zone |
At the moment, the technicals lean bearish, and the most logical action is to wait for either a bounce or breakdown confirmation.
- If you’re long, consider setting stops below $21.50 to protect capital.
- If you’re looking to short, a clean break below $22.00 offers a good risk/reward setup toward $20.80.
- A hold makes sense for swing traders waiting for clarity.
Fundamental Triggers to Watch
Intel is facing macro and micro headwinds:
- Upcoming Earnings: Intel is expected to report earnings next week. Any miss or guidance cut could trigger a fast breakdown below support.
- Semiconductor Sector Volatility: The SOXX ETF is showing weakness, and if Nvidia or AMD drops, INTC will likely follow.
- AI Chip Competition: Intel’s delay in next-gen AI accelerators is causing concern, especially compared to AMD’s MI300 and Nvidia’s dominance.
- Interest Rates / Fed Watch: Hawkish commentary from the Fed will weigh on tech stocks broadly.
- Institutional Outflows: There’s evidence of distribution near $24.00–$25.00, which supports the current bearish narrative.
Final Thoughts: INTC Outlook for July 2025
Intel’s stock chart is starting to roll over, and this could be the beginning of a deeper correction unless bulls quickly reclaim lost ground.
- Short-term outlook: Bearish bias unless price reclaims $23.80
- Medium-term setup: Watch for bounce or retest at $22.00–$21.50
- Long-term level: If $19.50 fails, the entire trend from June is invalidated
As a trader, I’d say: “We’re at a make-or-break level. If INTC bounces cleanly off $22 with heavy volume, I’d consider a long scalp back to $23.20. But if we slice through $22 without a fight, I’d let it bleed and re-enter closer to $20.50.”
