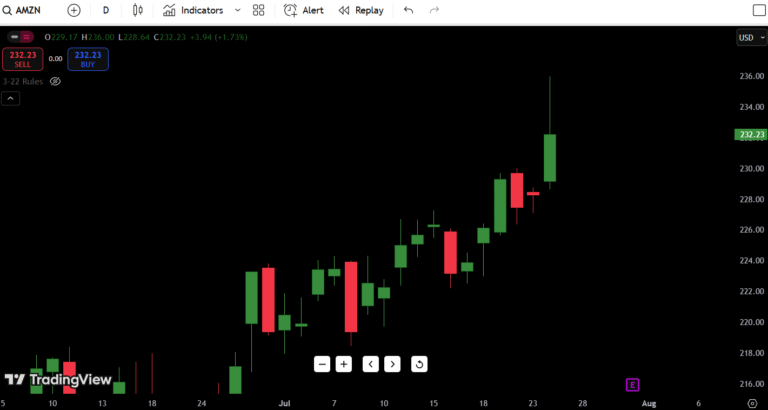
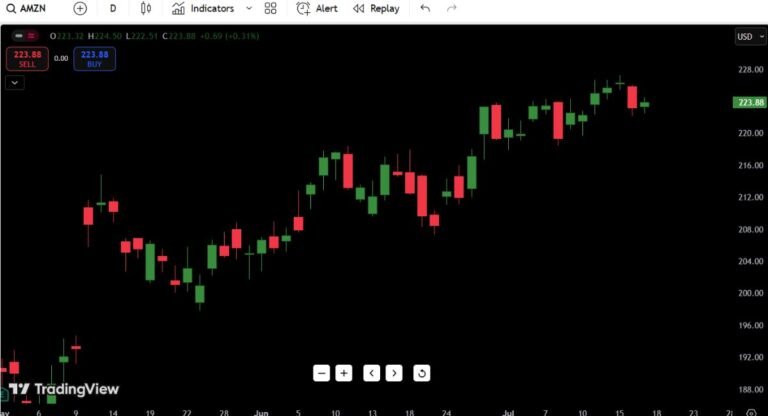
Amazon (AMZN) Stock Analysis – July 24, 2025: Buy or Bail?
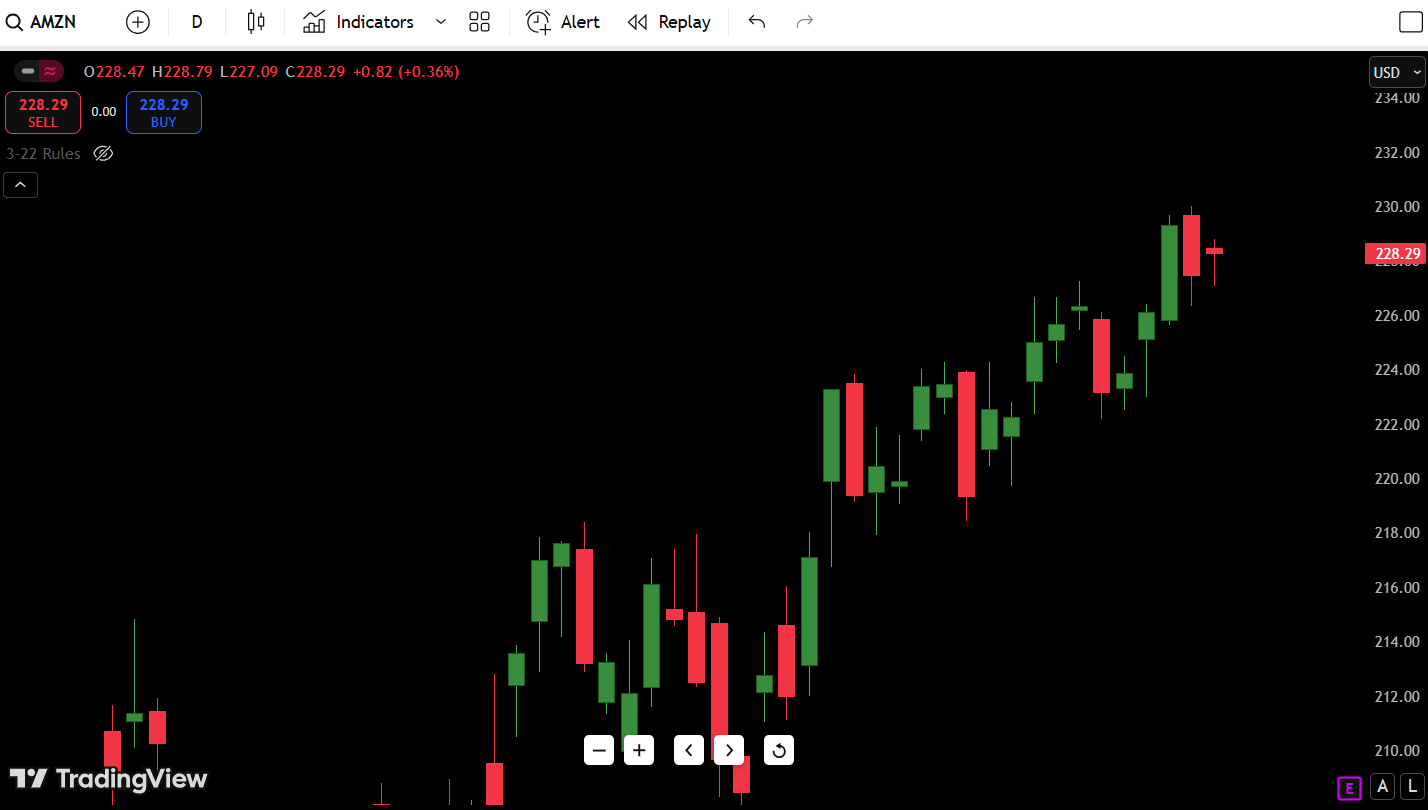
As of July 24, 2025, Amazon (AMZN) is trading at $228.29, not far from its daily high of $228.79. The stock remains in a solid short-term uptrend after reclaiming key structure levels, showing potential for further upside — but traders should stay cautious of a possible lower high trap.
- Apple Current Price July 24: $228.29
- Daily Direction: Bullish Bias
- Amazon Stock Price Prediction for July 24, 2025: Leaning bullish above $226.50
- 52-Week High and Low: $230.45 / $116.56
- Key Support Zone: $224.80–$226.50
- Key Resistance: $230.00–$232.60
One critical observation: The last few candles show strong buyer presence with consistent higher lows — but today’s candle is forming a potential spinning top, hinting at indecision. That makes the $228.50–$230 zone a pivotal level to monitor for a breakout or a fakeout reversal.
- Previous Day | Amazon (AMZN) Stock Analysis – July 24
Contents
Candlestick Chart Analysis
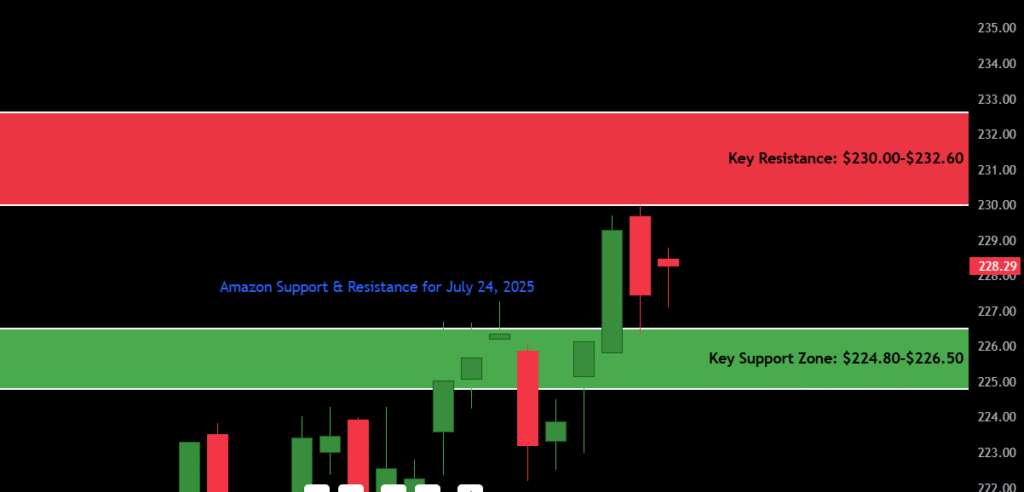
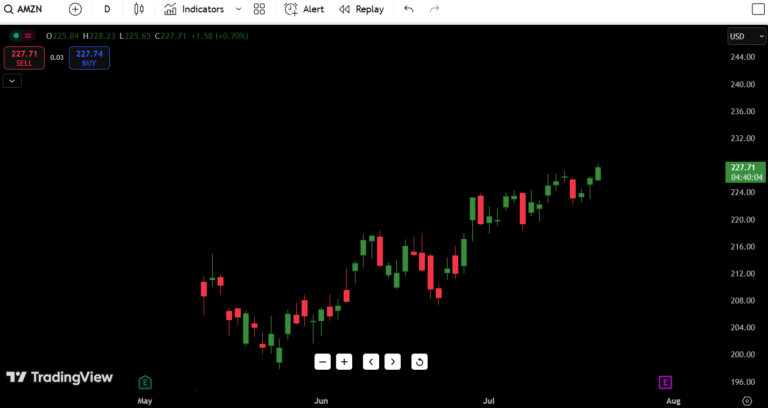
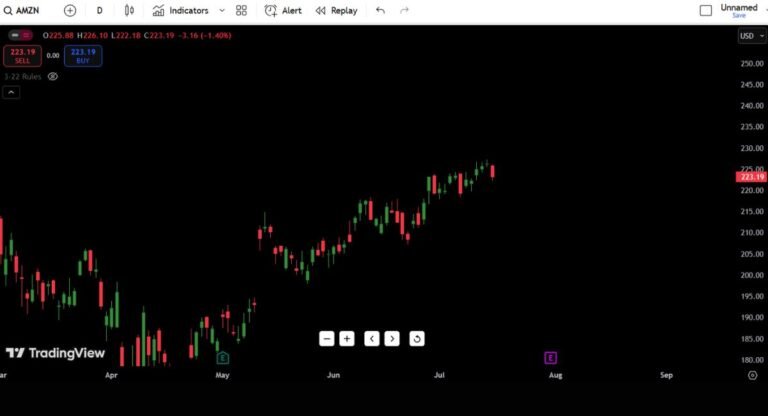
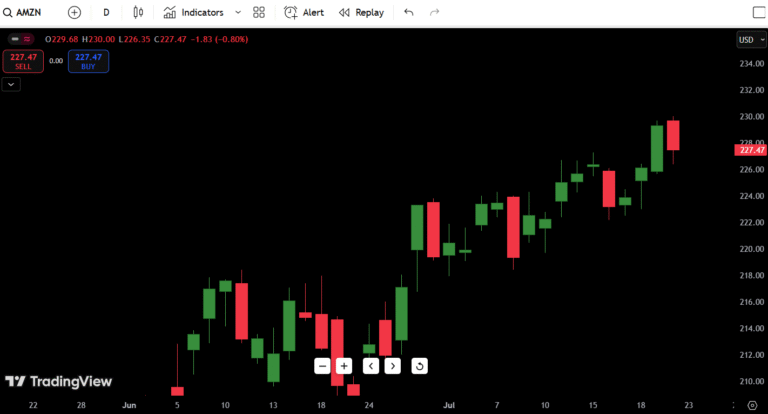
The daily candlestick chart for AMZN shows a clear uptrend forming since mid-July, with multiple bullish engulfing candles and strong continuation wicks.
Here’s what’s jumping out:
- Trend Structure: AMZN broke out of a mini consolidation zone near $215 and pushed past multiple resistance levels with conviction.
- Candlestick Behavior: Recent sessions printed long-bodied green candles with narrow red retracements — classic signs of healthy trend continuation.
- Volume: Volume has been tapering slightly, which may indicate buyer exhaustion or a potential pullback ahead. Keep an eye on volume spikes during resistance tests.
- Today’s Candle: The current candle is printing a small-bodied indecision bar, signaling potential consolidation or a reversal attempt if buyers don’t step in quickly.
- No Clear Reversal Pattern Yet: There’s no major bearish engulfing or evening star structure in sight. This means the uptrend still holds unless $226 is broken.
Overall, AMZN is trending bullish, but bulls need to see a clean close above $230 to confirm a breakout. Otherwise, this might become a classic fakeout to trap breakout buyers.
Support and Resistance Levels Table
| Type | Price Level | Description |
|---|---|---|
| Resistance 1 | $230.00 | Round number, current ceiling |
| Resistance 2 | $232.60 | Last supply wick from April |
| Resistance 3 | $238.70 | Near-term breakout expansion target |
| Resistance 4 | $252.90 | 52-week high |
| Support 1 | $226.50 | Short-term demand base |
| Support 2 | $224.80 | Last minor pullback level |
| Support 3 | $220.20 | Higher low from breakout leg |
| Support 4 | $210.00 | Long-term pivot, demand shelf |
The most important level right now is $226.50 — as long as AMZN holds above this, the bullish thesis remains intact. A clean daily close below it could shift sentiment quickly.
7-Day Price Forecast Table
| Date | High | Low | Expected Close |
|---|---|---|---|
| July 24 | $229.50 | $226.00 | $228.10 |
| July 25 | $231.00 | $227.20 | $230.30 |
| July 26 | $232.60 | $229.10 | $231.90 |
| July 27 | $233.40 | $230.50 | $232.00 |
| July 28 | $234.00 | $230.20 | $231.20 |
| July 29 | $235.50 | $231.00 | $234.40 |
| July 30 | $238.00 | $233.50 | $236.70 |
Forecast Insight:
If AMZN can hold above $226.50, expect a grind upward toward the $232.60 zone by the end of the week. However, if price rejects $230 repeatedly and fails to hold $226, a drop toward $220 could play out fast.
Buy, Hold, or Sell Decision Table
| Action | Trigger Condition | Reasoning |
|---|---|---|
| BUY | Close above $230.20 | Confirmed breakout over key level |
| HOLD | Range between $226–$230 | Tight chop zone, unclear momentum |
| SELL | Break below $226.00 | Trend breakdown, bears regain grip |
Buy Scenario: A daily close above $230.20 with strong volume would confirm a breakout. In that case, price could expand toward the $234–$238 range quickly, offering a 3:1+ risk/reward swing setup.
Hold Zone: If AMZN floats between $226 and $230, it’s best to wait. That’s a liquidity trap zone, often designed to fake out retail traders.
Sell Setup: A decisive break below $226, especially with rising volume, would signal a trend shift. That could open the doors to a correction toward $220 or lower.
Fundamental Triggers
Several upcoming catalysts could affect AMZN stock price today and over the coming week:
- Q2 Earnings: Scheduled for next week — the market is already positioning ahead of this. Any weak guidance could reverse momentum.
- Interest Rate Noise: The Fed’s July policy tone may shake Big Tech sentiment. A hawkish stance could pressure growth names like Amazon.
- Consumer Spending Data: Macro reports around retail and e-commerce trends could directly impact Amazon’s short-term outlook.
- Institutional Flow: Whale accumulation near the $215 level earlier this month was evident in volume bursts. Track if those funds are trimming or holding above $230.
Final Thoughts
Outlook: Bullish Bias — Cautiously Optimistic
Key Levels to Watch:
- Bullish Breakout Trigger: $230.20
- Bearish Breakdown Trigger: $226.00
- Range to Avoid Trading: $226.50–$230
AMZN has printed a textbook uptrend with strong price structure and momentum since the July breakout. But as we sit just below a major psychological and structural resistance at $230, the next few sessions will be critical.
In my experience, rallying into resistance with low volume often sets up a liquidity sweep before a pullback. If we see a strong rejection at $230 again, I’ll be watching closely for a fade trade down to $224–$220. But if bulls step up with conviction, this could be the beginning of a bigger leg toward $240+.
Final Verdict:
Don’t chase the breakout let the candle close confirm it. If you’re already long from lower levels, trail stops below $226 and lock partial profits into strength.

