NVIDIA (NVDA) Stock Analysis – July 22, 2025
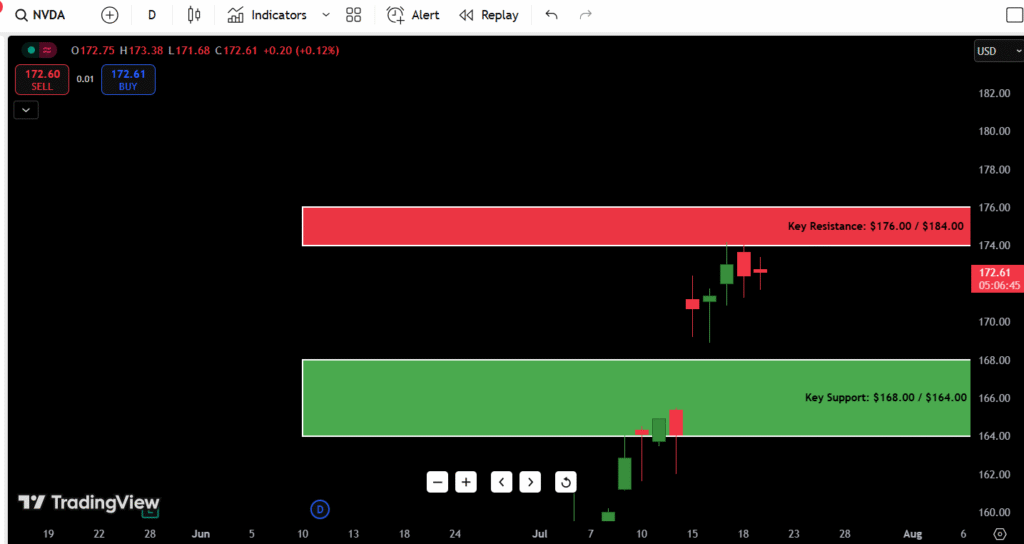
As of today, NVIDIA (NVDA) stock is trading at $172.73, up +0.19% for the session. The stock has been on a powerful multi-week uptrend, but is now stalling just beneath recent highs, printing small-bodied candles into resistance. Momentum looks strong—but caution is rising after this extended leg.
- Current Price: $172.73
- Daily Direction: Bullish but losing momentum
- 52-Week High: $184.00
- 52-Week Low: $116.00
- Key Support: $168.00 / $164.00
- Key Resistance: $176.00 / $184.00 (52-week high)

Observation for July 22:
NVIDIA is flagging beneath key resistance at $176–$178. If bulls can’t break out soon, this rally risks rolling over into a healthy pullback toward $164–$168. But any strong volume push through highs could ignite another breakout run.
Contents
- Candlestick Chart Analysis for July 22 Outlook
- Trend Overview:
- Recent Candlestick Behavior:
- Market Structure:
- Volume Profile (Visual Assessment):
- Support and Resistance Levels Table
- 7-Day Price Forecast Table (July 22 Start)
- Buy, Hold, or Sell Decision Table
- Current Bias:
- Fundamental Triggers to Watch
- Final Thoughts for July 22, 2025
- Outlook: Neutral to Slightly Bullish IF $176 Breaks
- What I’d Do As a Trader:
Candlestick Chart Analysis for July 22 Outlook
Trend Overview:
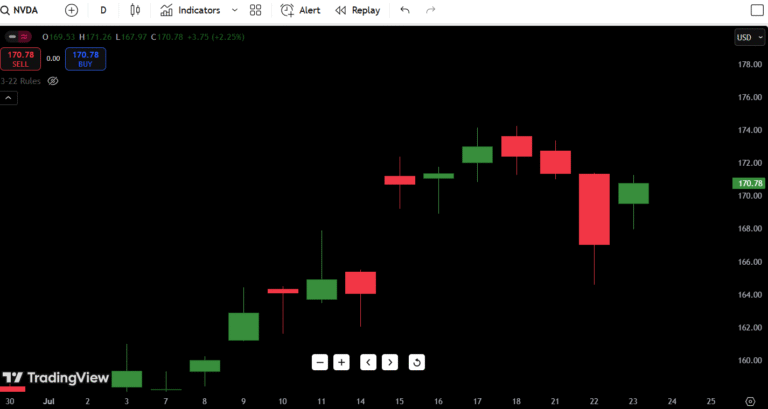
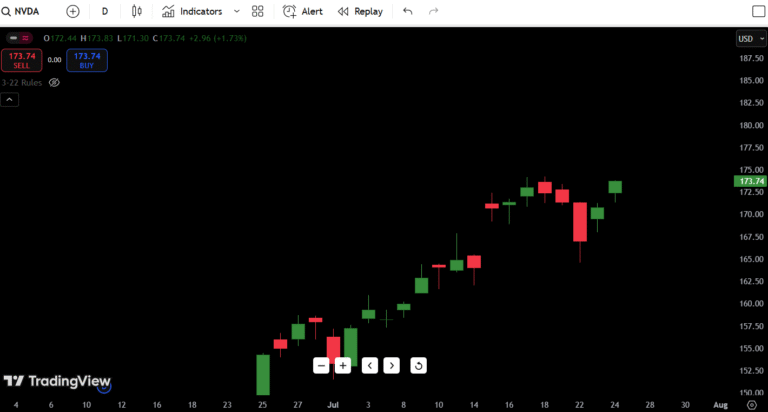
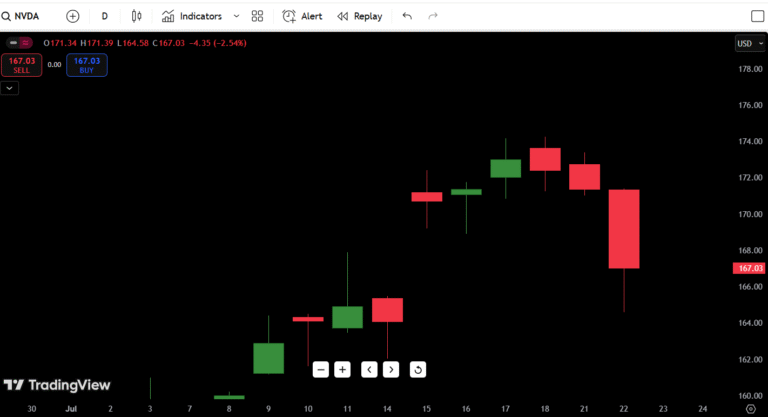
NVIDIA remains in a strong uptrend off its early June lows near $140. Price action has been clean, stair-stepping higher with healthy pullbacks. But the current candles show tightening ranges—a classic pause or flag pattern.
Recent Candlestick Behavior:
- Small-bodied candles near recent highs show hesitation.
- Minor rejection wicks suggest some sellers defending $175+.
- Today’s candle is a neutral inside bar—buyers aren’t aggressive, but sellers aren’t dominant either.
Market Structure:
- Short-Term: Uptrend slowing, possible bull flag forming.
- Macro: Still strong, but running hot after a sharp climb.
- Critical zone: $176–$178 breakout OR breakdown back to $164.
Volume Profile (Visual Assessment):
- Volume declining the past 4 sessions—classic pre-breakout OR exhaustion signal.
- Watch for volume spike confirmation before trusting any breakout.
Summary: If NVDA doesn’t clear $176–$178 soon with volume, we likely see a controlled fade toward $164–$168 support. Above $178? Next stop is likely $184 retest.
Support and Resistance Levels Table
| Type | Price Level | Description |
|---|---|---|
| Resistance 1 | $176.00 | Current short-term ceiling |
| Resistance 2 | $178.00 | Minor breakout trigger |
| Resistance 3 | $184.00 | 52-week high |
| Resistance 4 | $190.00 | Round number / future target zone |
| Support 1 | $168.00 | Nearest recent demand zone |
| Support 2 | $164.00 | Recent breakout retest area |
| Support 3 | $155.00 | Prior consolidation zone |
| Support 4 | $140.00 | Previous major low |
Key Level: $176 breakout or $168 failure will dictate NVDA’s next move.
7-Day Price Forecast Table (July 22 Start)
| Date | High | Low | Expected Close |
|---|---|---|---|
| July 22 | $176 | $170 | $172 |
| July 23 | $178 | $172 | $175 |
| July 24 | $180 | $174 | $178 |
| July 25 | $184 | $178 | $182 |
| July 26 | $182 | $175 | $178 |
| July 27 | $176 | $168 | $172 |
| July 28 | $170 | $164 | $168 |
Forecast Logic:
If NVDA breaks $176–$178 early this week, bulls likely push toward $182–$184 quickly. If it stalls or reverses, expect a pullback to $168–$164 for a healthy consolidation.
Buy, Hold, or Sell Decision Table
| Action | Trigger Condition | Reasoning |
|---|---|---|
| BUY | Break above $178 | Momentum breakout confirmed |
| HOLD | Range-bound $168–$176 | Healthy digestion, trend intact |
| SELL | Break below $168 | Momentum stalling, pullback begins |
Current Bias:
Hold if long, wait for breakout confirmation to add.
At this stage, NVDA looks extended but not broken. Chasing here without a breakout over $176–$178 is risky; better trade location comes either on strength through highs, or a healthy dip toward $164.
Fundamental Triggers to Watch
- Earnings Season: NVIDIA’s next earnings report is weeks away but will loom large.
- AI Sector Sentiment: NVDA remains a bellwether for AI; any weakness in AI peers could drag sentiment.
- Macro Tech Flows: NVDA tracks closely with QQQ, SOXX, SMH ETFs. Tech-wide corrections could ripple.
- Fed Outlook: Any surprising Fed comments on rates could trigger volatility in high-beta names like NVDA.
- Upgrades/Downgrades: Analysts remain bullish, but downgrades here would sting more after this big run.
Final Thoughts for July 22, 2025
Outlook: Neutral to Slightly Bullish IF $176 Breaks
This is a classic “pause at highs” setup. Either NVDA breaks $176–$178 and trends higher toward $184+, or we get a clean fade back to $168–$164 for rebalancing.
Watch these zones:
- Breakout Zone: $176–$178
- Pullback Support: $168–$164
What I’d Do As a Trader:
- Not buying the highs unless we break $178 on volume.
- Would prefer dip buys near $164–$168 where risk/reward is more favorable.
- If we see a weak breakout attempt fail? Fade short back to $168 support.
In my experience, extended runs like this into resistance zones often trap late buyers if volume doesn’t confirm. Patience beats FOMO at highs.


