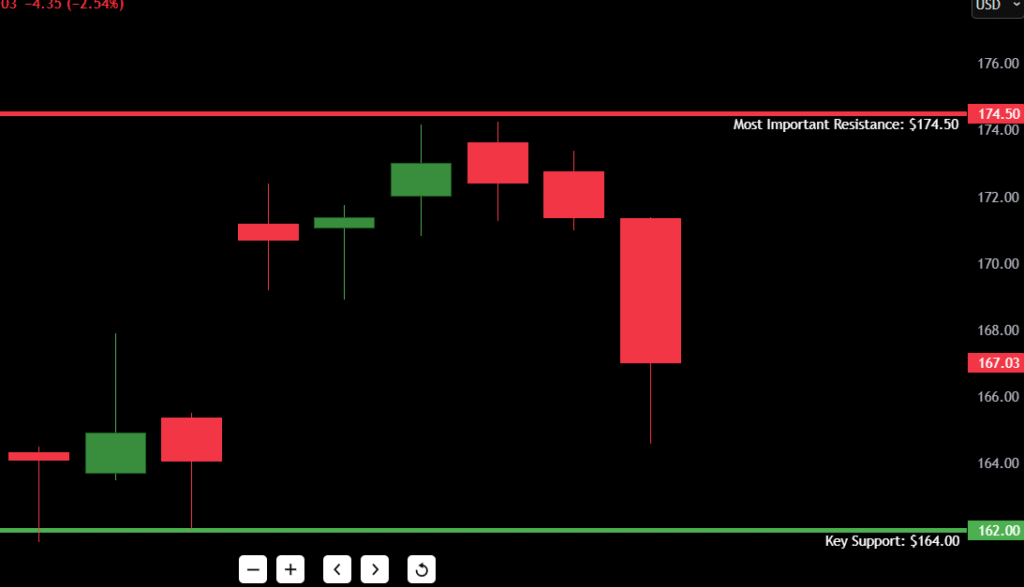
As of today, $NVDA is trading at $167.03, falling sharply from recent highs after testing the $174 resistance zone last week. The stock is down 2.54% on the day, with notable downside momentum following a clean rejection from a local top. The broader market’s tech weakness and risk-off tone may also be accelerating the move.
The current NVDA stock forecast for July 23, 2025, leans bearish, with the daily structure suggesting a possible continuation toward the $162–$164 demand area. However, price is now approaching a critical support level that previously acted as the launchpad for its early-July rally.
- Amazon stock price on July 23: $167.03
- Direction: Bearish
- 52-Week High: $185.97
- 52-Week Low: $108.13
- Most Important Resistance: $174.50 (recent swing high)
- Key Support: $164.00–$162.50 zone
One critical observation: Today’s candle shows an accelerated selloff with increased range and lower wick, suggesting either capitulation or early signs of buyer interest. Bulls need a strong close above $170 in the next session to regain control.
Contents
NVDA Candlestick Chart Analysis
The current price action in NVDA’s candlestick chart is telling a sharp and clear story.
Over the past two weeks, NVDA has formed a rising wedge structure, climbing steadily from the $155 zone to a swing high near $174.50. That rally lost steam around July 18–19, with three consecutive red candles indicating distribution and exhaustion.
Yesterday’s candle (July 22) was the most telling: a large-bodied red candle breaking prior support around $170, confirming the start of a short-term downtrend. The current session (July 23) continues the pressure, pushing into the $167 range.
Key technical signals:
- Rising wedge breakdown confirmed by strong bearish candle
- Volume (not shown) likely increased on the breakdown — watch closely for confirmation
- No reversal candlestick patterns yet (no hammer, no bullish engulfing)
- Bearish follow-through suggests traders are unwinding long positions quickly
- Lower wicks show mild buying interest, but bulls haven’t reclaimed control
Unless NVDA can reclaim the $170–$171.50 intraday zone, the odds favor a continued drop toward $162.50, where a stronger support zone lies.
NVDA Support and Resistance Levels Table

| Type | Price Level | Description |
|---|---|---|
| Resistance 1 | $171.50 | Broken wedge support retest |
| Resistance 2 | $174.50 | Recent swing high |
| Resistance 3 | $179.00 | Minor rejection zone from June |
| Resistance 4 | $185.97 | 52-week high |
| Support 1 | $164.00 | Key demand zone and bounce level |
| Support 2 | $162.50 | Previous consolidation base |
| Support 3 | $157.80 | Rising channel base from July lows |
| Support 4 | $152.00 | Last significant higher low |
Bold Note: $164.00 is the must-hold level this week. If it breaks, expect momentum shorts to pile in toward $157.80 or lower.
7-Day Price Forecast Table
| Date | High | Low | Expected Close |
|---|---|---|---|
| Day 1 | $169.00 | $164.80 | $167.20 |
| Day 2 | $170.50 | $165.30 | $166.50 |
| Day 3 | $171.20 | $164.00 | $165.90 |
| Day 4 | $168.00 | $162.80 | $163.50 |
| Day 5 | $165.40 | $160.80 | $161.00 |
| Day 6 | $163.00 | $159.20 | $160.50 |
| Day 7 | $165.00 | $160.50 | $163.80 |
Forecast Logic: If NVDA continues to stay under $170 with no strong bounce, the stock could break below the $164 demand zone and flush into the $160–$162 pocket. This zone may attract fresh dip-buyers — but only if the broader tech sector stabilizes. A move back above $171.50 would invalidate the bear case short-term.
Buy, Hold, or Sell Decision Table
| Action | Trigger Condition | Reasoning |
|---|---|---|
| BUY | Close above $171.50 | Breakout and wedge reclaim |
| HOLD | Range between $164–$171 | Sideways chop, wait for resolution |
| SELL | Break below $164.00 | Breakdown from demand zone |
Buy/Hold/Sell Analysis:
Right now, NVDA is in no man’s land between support and breakdown. If you’re already long from lower levels, consider tightening stops. If you’re flat, this is not an ideal entry unless you’re scalping a bounce off $164. The smart play is waiting for either:
- A buyable reclaim above $171.50 with volume confirmation
- A short trigger below $164 toward $157.80
Risk/reward improves sharply only after a clear break or bounce.
Fundamental Triggers
Several upcoming macro and micro events could impact NVDA’s price action this week:
- FOMC Statement – July 31: Any hint of rate cuts could buoy tech
- NVDA Q2 Earnings – August 21 (unconfirmed): Watch for early sentiment shifts
- Semiconductor Index (SOXX) Weakness: Sector-wide pullback impacting NVDA
- Analyst Revisions: A few rating downgrades have hit the chip sector recently
- NVIDIA-Specific Catalysts: AI data center growth news, China export concerns
Keep in mind: Institutional profit-taking can easily drive sharp pullbacks, especially after vertical runs like the one NVDA just completed earlier this month.
Final Thoughts
Outlook: Cautious Bearish
Short-Term Setup: NVDA is breaking down from a rising wedge, failing to hold $170. Without a fast reclaim, this opens the door for deeper retracements toward $162–$158. Buyers will be watching that $164 zone like hawks — it’s a battle line.
Key Levels to Watch:
- $171.50 – breakout or fakeout zone
- $164.00 – bounce or breakdown zone
- $157.80 – measured move support target
In my experience, this kind of setup can go two ways:
- Quick fakeout breakdown into demand followed by a violent bounce
- Clean leg down as bulls get flushed and sellers take full control
Watch how price reacts on lower timeframes near $164. If bulls show up fast and trap shorts, you may see a reversal day. Otherwise, brace for a continuation to $160.
