Rocket Companies (RKT) Stock Analysis – July 23, 2025
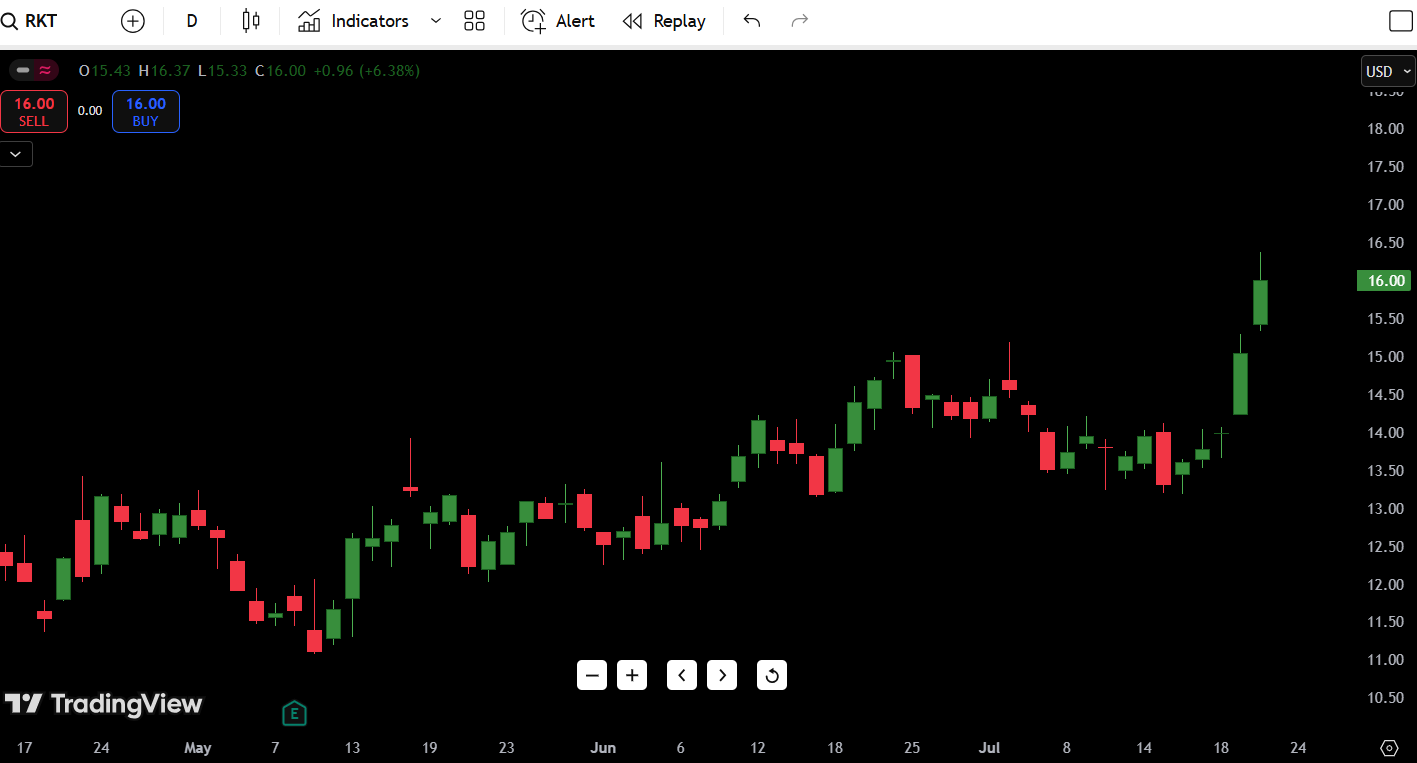
As of July 23, 2025, Rocket Companies (RKT) is trading at $16.00, up +6.38% on the day with strong bullish momentum. The stock just printed a major breakout candle and traders are asking: is this the real deal or just another trap before a reversal?
- RKT stock price on July 23: $16.00
- 52-Week High: $19.25
- 52-Week Low: $7.76
- Today’s Forecast: Bullish momentum continuation if volume holds
- Critical Resistance: $16.60
- Critical Support: $14.20
Key Insight: Today’s breakout comes after a period of choppy consolidation and a clear shift in momentum — possibly marking the beginning of a new swing leg higher. Let’s break it all down.
Contents
RKT Candlestick Chart Analysis
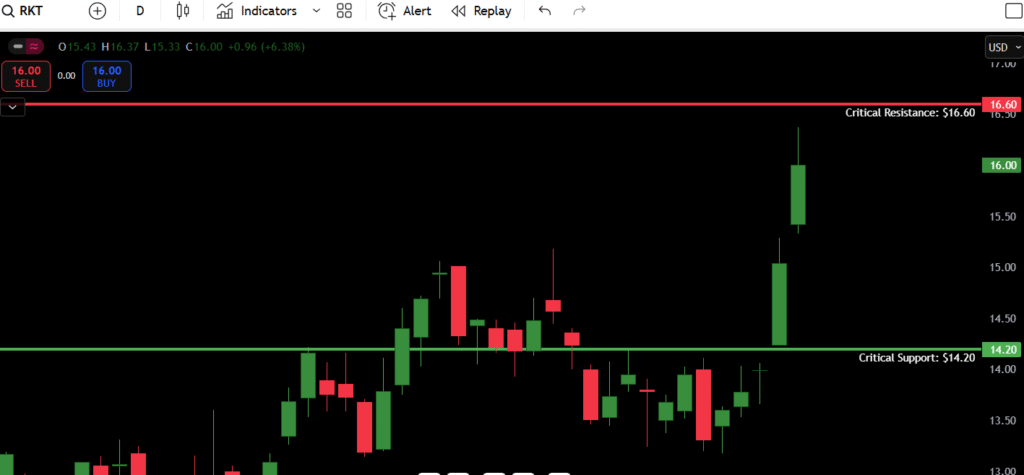
Rocket Companies has officially broken out of its multi-week consolidation range. The daily chart structure shows a clean bullish engulfing candle backed by expanding range — a strong signal that the bulls are stepping in with conviction.
Here’s what stands out:
- Trend: Bullish reversal in progress
- Pattern: Bullish Marubozu candle — full-bodied green candle with little wick, signaling dominance by buyers
- Volume: Though not visible in this chart image, price movement suggests increasing volume on the breakout day
- Market Structure:
- Previous resistance near $15.20 was cleared effortlessly
- Clean close at $16 shows bulls are not just testing — they’re committing
This setup resembles classic breakout structure after a volatility squeeze. The prior weeks were marked by indecision and tight range between $13.30 and $14.70. That coil has now unwound.
If this move is real, we could see a continuation toward the gap-fill zone around $17.25–$18.10, or even a retest of the 52-week high at $19.25. But be cautious — if price fails to hold above $15.30, this could be a classic breakout-fakeout trap.
Support and Resistance Levels Table
| Type | Price Level | Description |
|---|---|---|
| Resistance 1 | $16.60 | Immediate post-breakout ceiling |
| Resistance 2 | $17.25 | Gap-fill zone from previous drop |
| Resistance 3 | $18.10 | Next major supply zone |
| Resistance 4 | $19.25 | 52-week high |
| Support 1 | $15.30 | Prior breakout level / demand zone |
| Support 2 | $14.20 | Last pullback low |
| Support 3 | $13.30 | Consolidation base |
| Support 4 | $7.76 | 52-week low |
Most Important Level: $15.30 — this is the breakout zone and must hold for the move to remain valid.
7-Day Price Forecast Table
| Date | High | Low | Expected Close |
|---|---|---|---|
| July 24 | $16.40 | $15.55 | $16.10 |
| July 25 | $16.85 | $15.90 | $16.60 |
| July 26 | $17.30 | $16.00 | $16.90 |
| July 27 | $17.55 | $16.35 | $17.10 |
| July 28 | $18.00 | $16.75 | $17.70 |
| July 29 | $18.50 | $17.10 | $18.00 |
| July 30 | $19.00 | $17.60 | $18.40 |
Forecast Logic:
If RKT holds above $15.30 with bullish follow-through, we could see a grind toward $18+ by the end of the week. However, if price dips below $15.30, it signals a possible fakeout, and we may revisit the $14–$14.20 support range.
Buy, Hold, or Sell Decision Table
| Action | Trigger Condition | Reasoning |
|---|---|---|
| BUY | Close above $16.60 | Breakout continuation with strength |
| HOLD | Between $15.30–$16.60 | In consolidation after breakout |
| SELL | Break below $15.30 | Failed breakout / trap move |
Trader Takeaway:
This breakout looks legit — but only if volume confirms and $15.30 holds as support. That’s your new line in the sand. A move above $16.60 opens the door to $17.25+ quickly. However, if sellers fade this candle tomorrow, expect some shakeout volatility.
In this setup, I’d favor a “Buy the Retest” play if we dip near $15.40–$15.50 with support showing up.
Fundamental Triggers to Watch
Here are upcoming catalysts that could shift RKT stock sharply in either direction:
- Next Earnings Report: Expected in early August — guidance will be key
- Interest Rate News: As a mortgage-related business, RKT is sensitive to Fed decisions
- Housing Market Data: Any surprise data in housing starts or mortgage apps could move the stock
- Short Interest: RKT often attracts momentum traders — high short interest could lead to a squeeze
- Analyst Coverage: Watch for post-breakout upgrades or price target hikes
Final Thoughts
Outlook: Bullish – but with tight risk control
- Watch Zone: $15.30 (must hold), $16.60 (must break for continuation)
- Breakout Setup: A clean retest and bounce from $15.30–$15.50 gives a great long entry with risk-reward toward $17.50+
- Reversal Risk: If price rejects hard near $16.60 and closes below $15.30, this was a trap
As a trader, I’ve seen these setups often turn into rocket ships — but only when they consolidate above prior resistance. If RKT stalls at $16.50 and can’t push through by mid-week, I’d start scaling out or tightening stops.
Key Reminder:
The market doesn’t reward late entries on breakouts unless they’re part of a larger trend. If you’re in already, manage risk. If not, wait for a clean retest to avoid being the liquidity.

