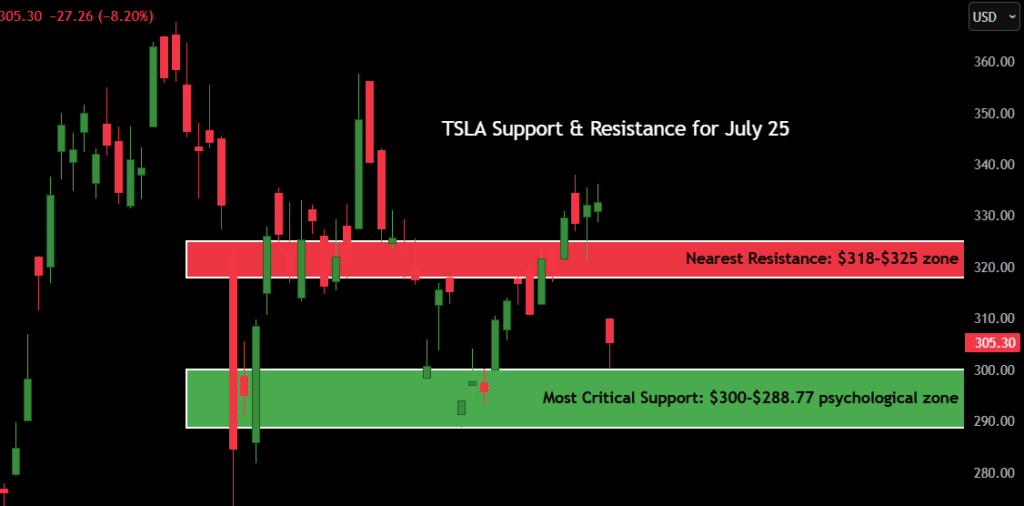
As of July 25, 2025, Tesla Inc. (TSLA) is trading at $305.30, closing the session down -8.20% on the day. That’s a brutal single-day loss of $27.26, wiping out nearly three weeks of bullish price action in one flush. The move comes after a gap down and hard rejection from the $340 region earlier this week.
- Current Price: $305.30
- Daily Direction: Strong Bearish
- 52-Week High: $399.29
- 52-Week Low: $219.20
- Most Critical Support: $300-$288.77 psychological zone
- Nearest Resistance: $318–$325 zone
Traders are eyeing whether today’s candle is the start of a deeper trend reversal or just a shakeout in an overall uptrend.
Also Read;
Contents
Candlestick Chart Analysis – Is This a Breakdown or a Trap?

Looking at today’s candlestick chart, the structure just flipped bearish in a big way.
We’ve got a strong red candle, high volume flush, and a close near the session low — all classic traits of a bearish engulfing breakdown. After weeks of slow grind-up from late June, this breakdown suggests momentum has decisively shifted short-term.
Here’s what we’re seeing:
- Daily candle: Large-bodied red bar with no bottom wick, signaling aggressive selling.
- Price action: Breakdown below the rising trendline that supported the July rally.
- Volume: Elevated — confirming the sell-off wasn’t passive profit-taking, but active selling.
- Structure: Break of prior consolidation zone ($318–$325) now looks like a bull trap.
- Micro-pattern: This may be part of a fakeout-breakout pattern, where bulls got trapped chasing the recent highs and are now being forced to unwind.
Unless TSLA reclaims $318 fast, it looks like we’re headed to test the $300–$295 demand zone next.
Key takeaway: TSLA just printed a textbook breakdown candle. The next couple of sessions are critical — bulls need a reclaim, or this slide could accelerate fast.
TSLA Support and Resistance Levels Table
| Type | Price Level | Description |
|---|---|---|
| Resistance 1 | $318.00 | Recent swing high / failed breakout |
| Resistance 2 | $325.00 | Key range top from July |
| Resistance 3 | $340.00 | High from mid-June |
| Resistance 4 | $399.29 | 52-week high |
| Support 1 | $300.00 | Psychological and round-number level |
| Support 2 | $295.00 | Previous bounce zone from June lows |
| Support 3 | $280.00 | Strong demand zone in late May |
| Support 4 | $219.20 | 52-week low |
The $300 support is absolutely critical. If this area gives way, it opens up air toward $280 quickly. On the flip side, if bulls defend $300 with volume, we could see a fake breakdown setup that traps shorts.
7-Day Price Forecast Table
| Date | High | Low | Expected Close |
|---|---|---|---|
| July 26 | $310 | $295 | $300 |
| July 27 | $315 | $298 | $308 |
| July 28 | $320 | $305 | $315 |
| July 29 | $318 | $307 | $312 |
| July 30 | $325 | $310 | $320 |
| July 31 | $328 | $312 | $318 |
| Aug 1 | $332 | $310 | $320 |
Forecast logic: If TSLA holds above $295, expect a relief bounce toward $315–$320. However, if we break and close below $295, the downtrend likely continues into next week. Bulls need to reclaim $318+ with strong volume to regain momentum.
Buy, Hold, or Sell Decision Table
| Action | Trigger Condition | Reasoning |
|---|---|---|
| BUY | Close above $318 | Breakout recovery with strong bids |
| HOLD | Range between $295–$318 | Consolidation after breakdown |
| SELL | Break below $295 | Breakdown confirmation to $280–$260 |
This week’s sell candle changes the short-term narrative. The previous bullish structure is broken. For now, TSLA is a “Hold” or “Short” — unless bulls quickly reclaim $318 with strong volume. If price consolidates around $300 and reclaims $310+, we may consider a long reversal setup with a stop under $295.
Short-term, aggressive traders may look to short bounces into the $312–$315 zone for a fade back into the $290s.
Fundamental Triggers to Watch
While the technicals scream breakdown, fundamental catalysts could easily shake things up. Here’s what we’re watching:
- Q2 Earnings Follow-Through: If sentiment continues to sour on margins or production, expect sustained weakness.
- Fed Meeting (Next Week): Any hawkish commentary could pressure high-beta tech like TSLA.
- EV Sector Rotation: With names like NIO and RIVN also pulling back, we may be seeing a sector-wide risk-off move.
- Tesla AI Day or New Product Rumors: Elon Musk headlines can always stir volatility.
- Short Interest / Options Flow: Elevated OI on puts this week could cause a gamma cascade or short squeeze if we reclaim $318.
Keep in mind: Tesla is a sentiment-heavy stock. It can whip both directions on headlines, tech sentiment, or even Elon’s tweets.
Final Thoughts – TSLA Stock Forecast & Personal Outlook
Right now, TSLA has flipped bearish short-term, with price breaking key structure on volume. This doesn’t mean the long-term bull case is over — but short-term momentum favors the bears unless proven otherwise.
What to watch:
- $300–$295 is the line in the sand. If it breaks, watch for acceleration toward $280.
- If bulls defend $300 and reclaim $318, this could morph into a powerful trap-and-reverse setup.
- A close below $295 invalidates bullish recovery hopes for now.
My view as a trader: This is where many breakout traders get punished. If bulls don’t show strength soon, I’ll be looking for a short into pops. But if we start basing above $300 and see a reclaim of $310+, I’ll flip bullish with a target back toward $325–$332.
Outlook: Cautious-to-bearish in the short term. Waiting for proof of reclaim.
Strategy: Stay patient. Let price prove itself. Either the breakdown holds — or it traps bears hard.
