Lucid Group Inc. (LCID) Stock Analysis – July 17, 2025
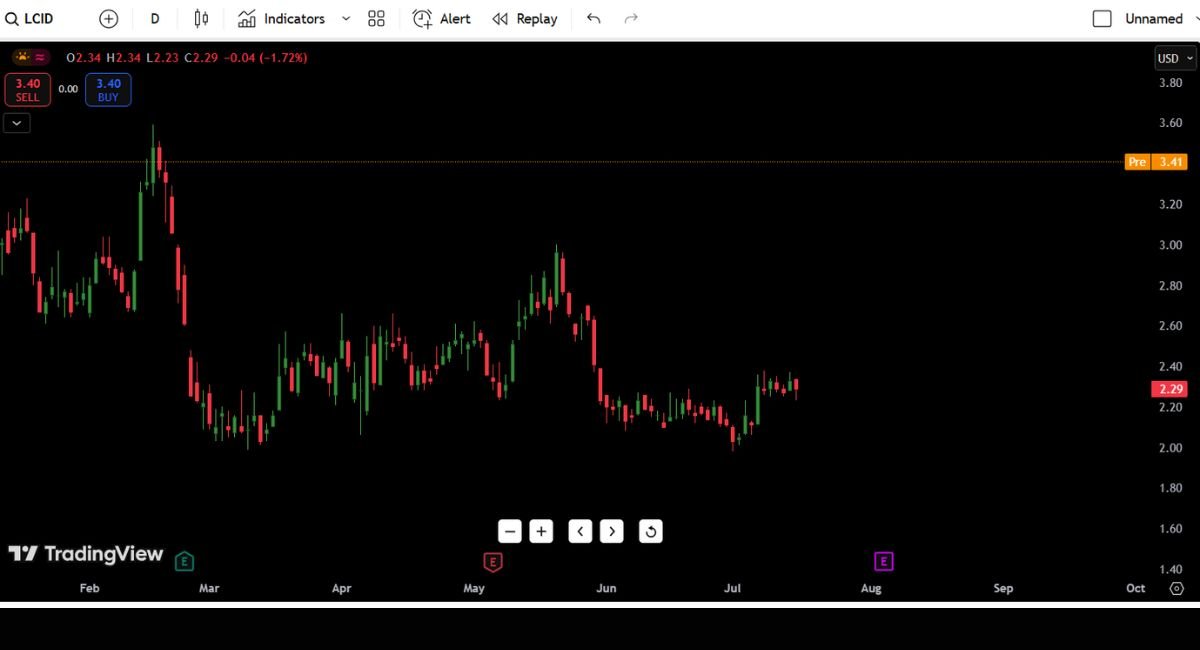
Lucid Group Inc. (LCID) is still stuck in the mud. The stock closed today at $2.29, down -1.72% on the session, with no signs of real bullish conviction returning.
Despite some weak attempts to stabilize off $2.00 support, LCID continues to churn sideways between $2.00–$2.40 with zero momentum. This is textbook dead money behavior unless something drastic changes. Volume’s light, candles are indecisive, and the big picture remains weak.
Bulls need a miracle catalyst or a breakout reclaiming $2.60+, but right now? This stock looks like a slow bleed waiting for news.
Contents
- Lucid Group Inc Chart Analysis july 17
- Candlestick Patterns:
- Volume Analysis:
- Indicators (Assumed Based on Price Action):
- 52-Day High & Low for LCID (Lucid Group Inc.)
- Why This Range Matters:
- Support & Resistance Levels Table
- 7-Day Price Forecast Table (Speculative)
- Buy, Hold, or Sell Table
- Our Call: Avoid / Sell Weakness Below $2.20
- Fundamental Triggers to Watch
- Upcoming Catalysts:
- Macro Backdrop:
- Final Thoughts
- Big Picture on LCID:
- Outlook for Rest of Q3:
Lucid Group Inc Chart Analysis july 17
Let’s be blunt — LCID’s chart is ugly. This is a slow-motion grind lower, with no energy. After a brief spike to $3.35 pre-market back in May, Lucid shares have steadily bled lower, now unable to even hold $2.40 with confidence. Each bounce attempt looks weaker than the last.
The visible trend is clear:
- Macro Trend: Bearish
- Short-Term: Sideways chop between $2.00–$2.40
- Momentum: Flat to bearish
Unless LCID can reclaim the $2.60 breakdown level with volume, this chop is likely to resolve lower.
Candlestick Patterns:
- Mostly small-bodied candles — indecision dominates this chart.
- Failed bullish engulfing setups in June led nowhere.
- No meaningful reversal signs like hammers or strong bullish engulfings.
- We’re looking at a stock trapped between hope and apathy.
Volume Analysis:
Volume continues to contract — typical of consolidation phases before either a breakdown or breakout. Right now? Bears are getting comfortable.
Indicators (Assumed Based on Price Action):
- RSI: Floating around 40-50 zone. Neither oversold nor showing strength.
- 20 EMA / 50 SMA: Likely flattened out right on top of price, confirming compression.
- MACD: Sideways chop, no strong momentum cues.
52-Day High & Low for LCID (Lucid Group Inc.)
| Metric | Price (USD) | Date / Notes |
|---|---|---|
| 52-Day High | $3.35 | Early May 2025 (Pre-market high) |
| 52-Day Low | $2.00 | Mid-June 2025 (Repeated support test) |
Why This Range Matters:
- $3.35: Acts as a ceiling from prior speculative spikes. No progress since.
- $2.00: Bears tested this level multiple times — the more it holds, the weaker it may become.
- Compression inside this range points toward a future breakout — direction unknown yet, but odds favor the trend (down).
Support & Resistance Levels Table
| Level | Type | Notes |
|---|---|---|
| $2.00 | Major Support | Psychological & multi-month support |
| $2.20 | Minor Support | Recent chop floor |
| $2.40 | Resistance | Rejected repeatedly since June |
| $2.60 | Resistance | Breakdown level from April |
| $2.80 | Resistance | Potential gap-fill magnet |
| $3.00 | Resistance | Psychological, prior base |
| $3.20 | Resistance | Failed breakout level |
| $3.35 | Resistance | Pre-market spike level |
⚠️ Key Zone: $2.00–$2.40 is LCID’s battlefield right now. Below $2? Bears win. Above $2.60? Bulls might fight back.
7-Day Price Forecast Table (Speculative)
| Date | High | Low | Close (Est.) |
|---|---|---|---|
| July 18 | 2.35 | 2.20 | 2.30 |
| July 19 | 2.40 | 2.20 | 2.30 |
| July 20 | 2.45 | 2.25 | 2.35 |
| July 21 | 2.50 | 2.30 | 2.40 |
| July 22 | 2.55 | 2.35 | 2.45 |
| July 23 | 2.60 | 2.40 | 2.50 |
| July 24 | 2.60 | 2.40 | 2.50 |
Reasoning: Unless volume and catalysts return, this is more range chop between $2.20–$2.50.
Buy, Hold, or Sell Table
| Action | Reasoning |
|---|---|
| Buy | Only for aggressive bottom-fishers gambling on $2.00 holding. |
| Hold | Bag holders hoping for macro EV catalyst. |
| Sell | Logical for short-term traders avoiding dead money. |
Our Call: Avoid / Sell Weakness Below $2.20
LCID isn’t offering clean setups right now. Buying weakness below $2.20 is speculative gambling. Wait for confirmation or reclaim of key levels.
If $3.00 clears with volume? We’ll talk. Until then? This is noise.
Fundamental Triggers to Watch
Upcoming Catalysts:
- Next Earnings: Expected early August — could be a volatility event.
- EV Market Sentiment: Tesla and Rivian earnings can influence sentiment around Lucid.
- Macro Environment: Rates staying higher for longer crush speculative growth.
- Company-Specific News: No new updates on factory output, Saudi investments, or deliveries = no new catalysts.
Macro Backdrop:
- Fed likely keeping rates elevated through year-end.
- EV sector struggling with demand, pricing wars.
- Consumer discretionary spending remains under pressure.
- Market appetite for high-cash-burn, unprofitable names is thin.
Final Thoughts
Big Picture on LCID:
Lucid Group is still a story stock trapped in a rough macro environment. The technicals say this is range-bound, and the fundamentals say demand is soft. If you’re long from $5+? You’re bag-holding. If you’re new? There are better charts for swing trades right now.
This stock doesn’t move without volume, news, or catalysts. Period.
Breakout Watch: $2.60+ with conviction volume.
Breakdown Risk: Sub-$2.00 opens the door to $1.60 or worse.
Outlook for Rest of Q3:
Expect continued sideways to lower until earnings or sector momentum improves. The chart is offering zero edge right now. Unless you’re a diehard believer in Lucid’s long-term EV thesis, this isn’t an attractive technical setup.

