Navitas Semiconductor (NVTS) Stock Analysis – July 22, 2025
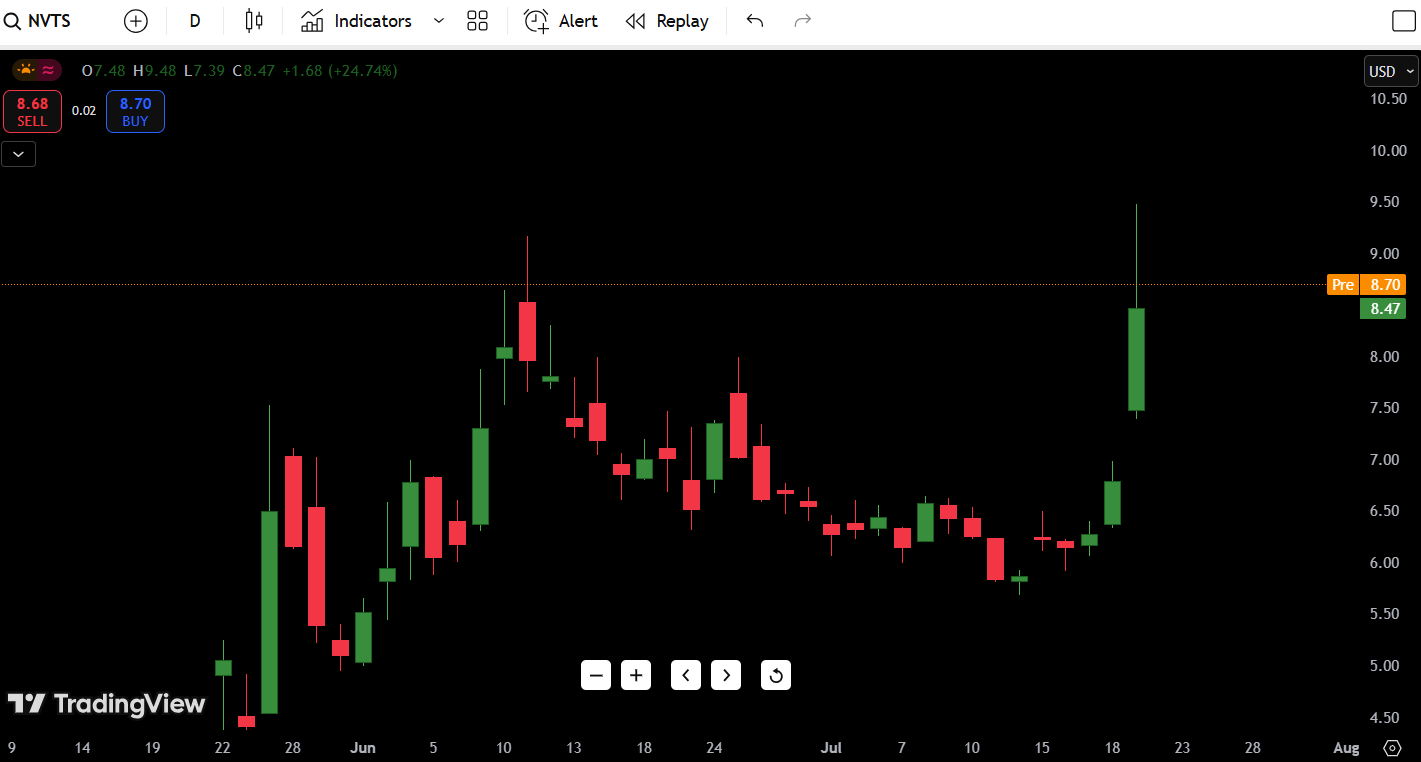
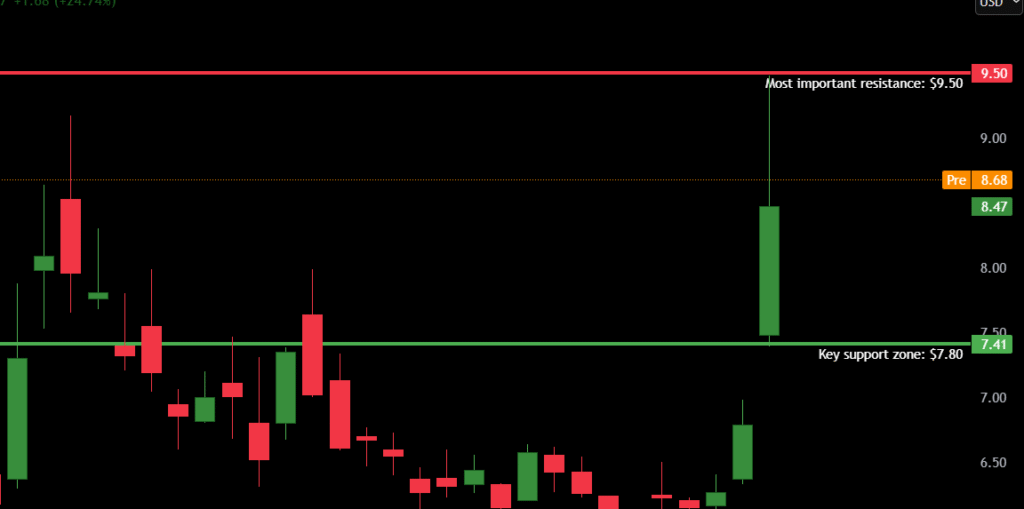
As of July 22, 2025, Navitas Semiconductor (NVTS) stock is trading at $8.47, up a jaw-dropping +24.74% on the day. Today’s monster candle shattered the recent consolidation range and put NVTS back on breakout watchlists across the trading community.
The stock has bounced aggressively off a low of $6.06, printing its strongest green daily candle in over 6 months. The current move is targeting the psychological $9.00 level, with potential continuation if volume sustains.
- 52-Week High: $10.87
- 52-Week Low: $4.22
- Most important resistance: $9.50
- Key support zone: $7.41
The real question now: Is this breakout real, or will it fade like June’s spike?
Contents
2Candlestick Chart Analysis
Let’s break down the technical action using the daily chart.
Trend: Short-Term Bullish Reversal
NVTS has spent the past six weeks grinding in a tight downtrend channel, bouncing between $6.00 and $7.00. That changed dramatically today with a powerful breakout candle.
Candlestick Behavior:
- Today’s session produced a massive bullish engulfing candle, reclaiming multiple weeks of bearish structure in one move.
- The candle pierced above the $7.80–$8.20 resistance band, closing strongly with minimal upper wick — showing buyers stayed in control all day.
- Price action resembles a high-conviction breakout, not a short-lived pump.
Volume Profile:
- Volume spiked significantly, the highest seen since early June, confirming that this is not a low-volume head-fake.
- Volume and price are moving in sync, a key condition for sustainable moves.
Market Structure:
- This breakout occurs after a clean base formation, resembling a cup-and-handle breakout if follow-through continues tomorrow.
- The next liquidity magnet sits around $9.50–$10.00, where sellers stepped in hard during June’s failed breakout.
Support and Resistance Levels
| Type | Price Level | Description |
|---|---|---|
| Resistance 1 | $9.50 | Prior June high |
| Resistance 2 | $10.00 | Psychological round number |
| Resistance 3 | $10.87 | 52-week high |
| Resistance 4 | $11.30 | Gap-fill zone from April |
| Support 1 | $7.80 | Breakout retest zone |
| Support 2 | $7.20 | Last pullback before breakout |
| Support 3 | $6.50 | July consolidation base |
| Support 4 | $4.22 | 52-week low |
🔑 Key level to watch: If NVTS can hold above $7.80, bulls remain in control. But a close back below that could signal a false breakout trap.
7-Day Price Forecast
| Date | High | Low | Expected Close |
|---|---|---|---|
| Day 1 | $8.80 | $8.10 | $8.50 |
| Day 2 | $9.30 | $8.20 | $8.90 |
| Day 3 | $9.80 | $8.70 | $9.40 |
| Day 4 | $10.20 | $9.00 | $9.90 |
| Day 5 | $10.50 | $9.20 | $10.10 |
| Day 6 | $11.00 | $9.80 | $10.40 |
| Day 7 | $11.30 | $10.00 | $10.90 |
Forecast Logic:
If NVTS can consolidate near $8.50–$9.00 and build volume, it could initiate a bullish leg toward the 52-week high at $10.87. A break and close below $7.80, however, would invalidate the breakout and shift the short-term outlook back to neutral.
Buy, Hold, or Sell Decision Table
| Action | Trigger Condition | Reasoning |
|---|---|---|
| BUY | Close above $9.50 | Breakout above prior high |
| HOLD | Between $7.80–$9.50 | Healthy consolidation post breakout |
| SELL | Break below $7.80 | Failed breakout, possible fade |
Current CTA: HOLD with Bias to Buy on Breakout
Today’s move is powerful, but chasing a +25% day blindly is risky. Let NVTS prove strength above $9.50 with sustained volume. That would be a high-conviction buy setup. Until then, hold your position if in, and let the price action dictate the next move.
Fundamental Triggers
While today’s action is technical, NVTS does have a few upcoming catalysts that could sustain this move:
- Earnings Report: Expected in mid-August — surprise upside could fuel continuation.
- Semiconductor Sector Strength: NVTS benefits from positive sentiment in the power electronics and AI chip supply chain.
- Analyst Attention: This kind of breakout often attracts institutional eyes, especially given NVTS’s relatively low float.
- Green Energy Tailwinds: As a GaN (gallium nitride) power player, NVTS is well-positioned for long-term thematic flows.
7. Final Thoughts
- Outlook: Bullish but needs confirmation
- Breakout Level to Clear: $9.50
- Failure Zone to Watch: $7.80
Navitas Semiconductor (NVTS) just printed a textbook breakout candle off a prolonged base but we’ve seen false starts before. The move is legit so far, backed by volume, but momentum buyers should wait for a clean push above $9.50 before piling in.
Trader’s Take: “This is the kind of candle that catches fire if followed by another day of green. But if it fails to hold above $8.00, you can bet the algos will start fading this fast. I’m looking for an entry only on strength above $9.50 — otherwise, it’s a fade back to the mean.”

