Alphabet Inc. (GOOGL) Stock Analysis – July 23, 2025
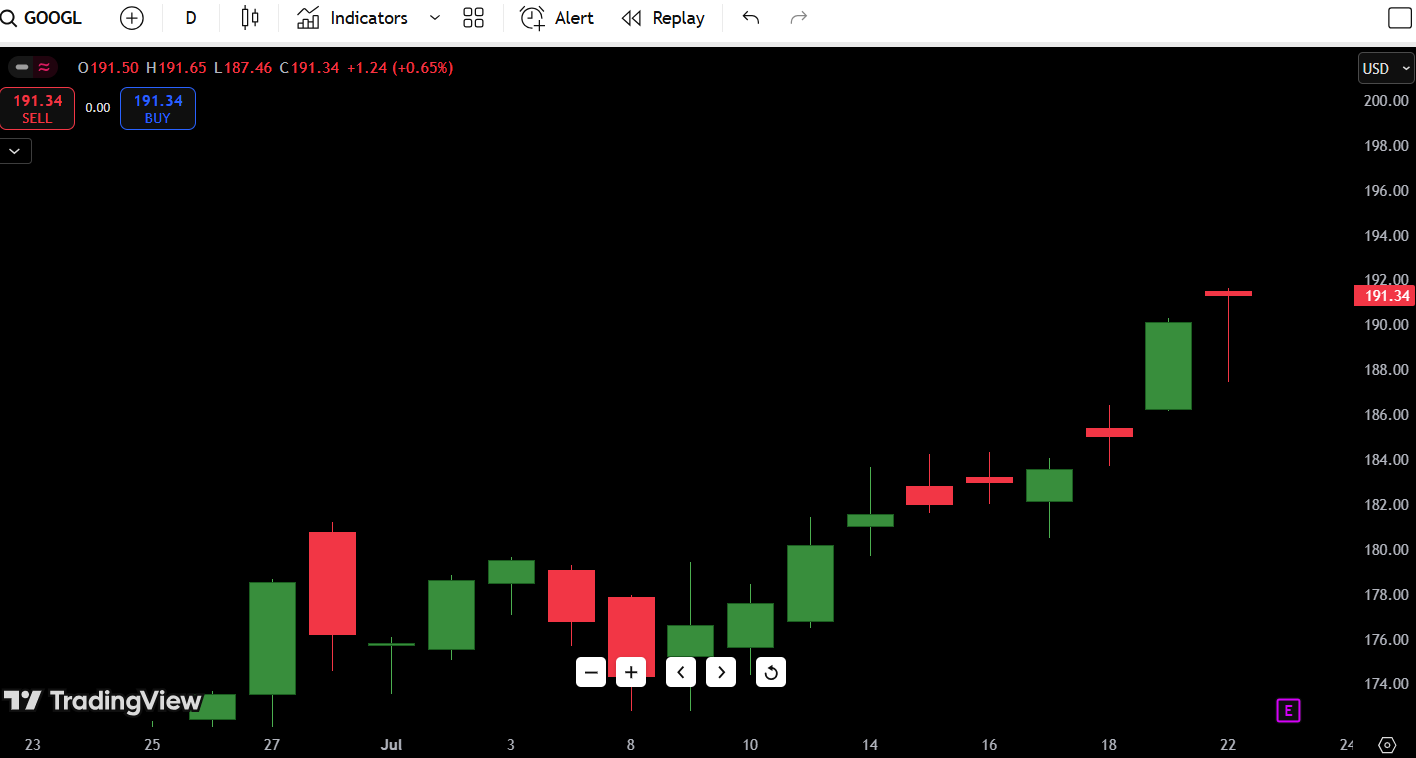
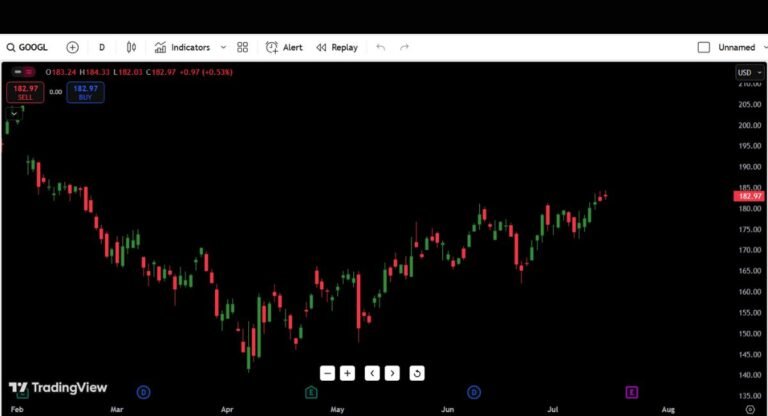
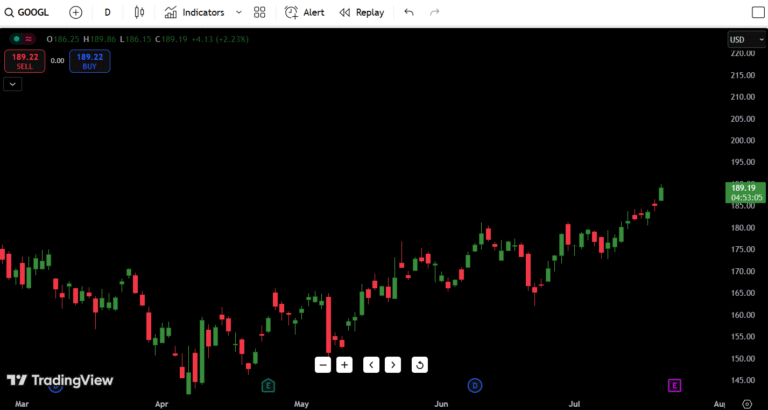
As of today, Alphabet Inc. (GOOGL) is trading at $191.34, closing +0.65% higher after tapping a session high of $191.65. The stock has extended its July rally and is now sitting just below key psychological resistance at $192.
- Google stock price on July 23: $191.31
- GOOGL Stock Forecast for July 23: Bullish with momentum
- Daily Direction: Bullish continuation
- 52-Week High: $194.75
- 52-Week Low: $115.78
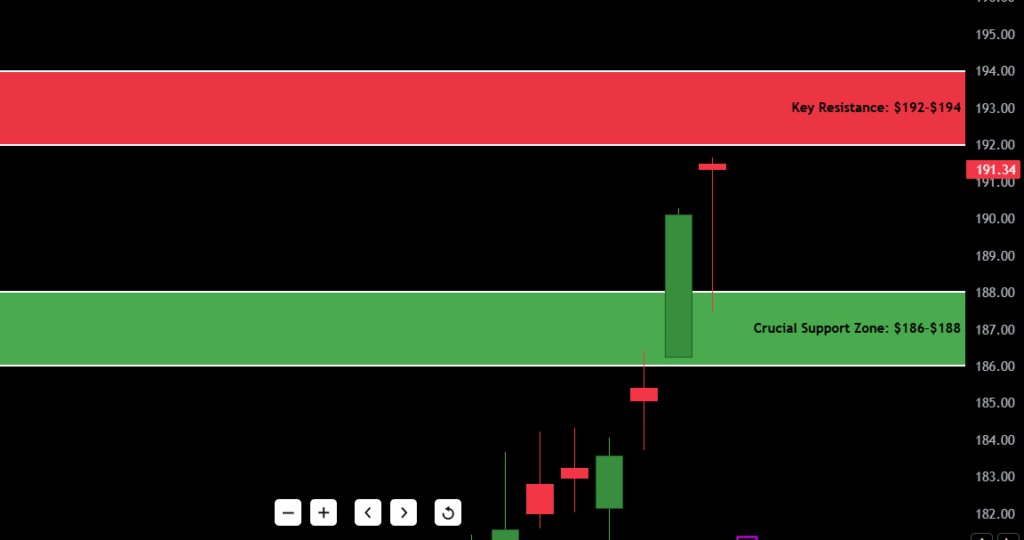
- Key Resistance: $192–$194
- Crucial Support Zone: $186–$188
GOOGL has been printing a clean staircase of higher highs and higher lows. Today’s candle follows a large-bodied bullish move from the previous session, hinting that buyers are not done yet — though exhaustion could creep in near all-time highs.
Contents
GOOGL Candlestick Chart Analysis – Price Action Today
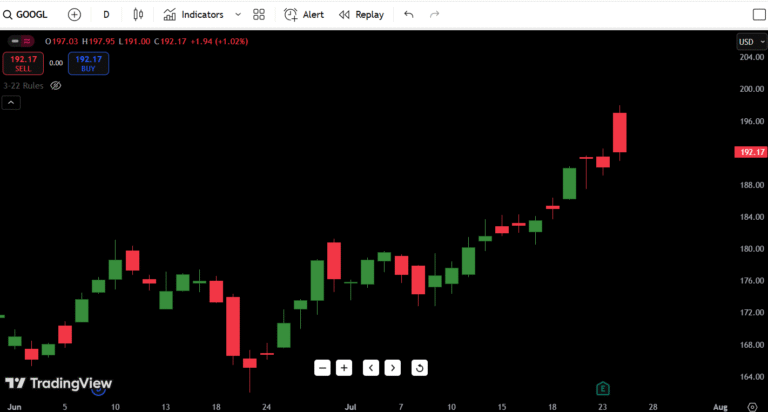
GOOGL’s daily candlestick chart shows strong bullish structure and a textbook trend continuation setup:
- Trend: Clear uptrend, with well-defined higher lows since July 8. The breakout candle from July 22 was wide-bodied and broke above minor resistance at $186.
- Pattern: Today’s candle is a narrow-body continuation bar, often seen in bullish pauses or flags. It tested higher and held most gains — no significant rejection wick, showing strong buyer presence.
- Momentum: Recent candles are expanding, especially the surge from $184 to $191 on July 22 — showing momentum ignition.
- Volume (inferred): Judging by the range and follow-through, institutional participation seems likely. This was not a random uptick — it’s clean, controlled strength.
- Market Structure Shift: GOOGL has reclaimed the June highs and is approaching multi-year resistance — a big test for buyers around $194.50–$195.00.
Traders should note: there’s no reversal signal yet. But this vertical climb into resistance suggests a pullback or consolidation may follow within the next 1–3 sessions.
Support and Resistance Levels for GOOGL
| Type | Price Level | Description |
|---|---|---|
| Resistance 1 | $192.00 | Psychological and round-number cap |
| Resistance 2 | $194.75 | 52-week high |
| Resistance 3 | $198.00 | Fib extension + macro level |
| Resistance 4 | $204.00 | Stretch target (2021 ATH zone) |
| Support 1 | $188.00 | Last breakout candle close |
| Support 2 | $186.00 | Previous pivot high (July 18) |
| Support 3 | $181.50 | Minor retest level |
| Support 4 | $175.00 | Prior base from July 8–10 |
🟢 Key Level to Watch: A daily hold above $188 keeps bulls in control. Below that, sellers may test $186.
📅 GOOGL 7-Day Price Forecast
| Date | High | Low | Expected Close |
|---|---|---|---|
| Day 1 (7/24) | $193.00 | $189.00 | $191.00 |
| Day 2 (7/25) | $194.50 | $190.00 | $192.75 |
| Day 3 (7/26) | $196.00 | $191.00 | $194.20 |
| Day 4 (7/27) | $197.50 | $193.50 | $195.10 |
| Day 5 (7/28) | $198.00 | $194.00 | $196.25 |
| Day 6 (7/29) | $199.00 | $195.00 | $197.50 |
| Day 7 (7/30) | $201.00 | $197.00 | $200.25 |
Forecast logic:
As long as GOOGL stays above $188, the path of least resistance is higher. If it reclaims the $194.75 52-week high, we could see a clean breakout to $198–$200+. However, any stall near resistance without volume could invite a short-term cool-off back to $186.
🧭 Buy, Hold, or Sell? – GOOGL Stock Trading Plan
| Action | Trigger Condition | Reasoning |
|---|---|---|
| BUY | Close above $194.75 | 52-week breakout with trend support |
| HOLD | Between $188–$194 | Bullish range, trend intact |
| SELL | Break below $186 | Failed breakout + short-term top |
What Traders Should Do Now
If you’re long: You’re in great shape. Trail stops just under $188 and ride the move toward $195+. Be cautious around $194.75, as it’s historically sticky.
If you’re looking to buy: Wait for either a pullback to $188–$190 (and confirm support) or a breakout candle above $194.75 on volume.
If you’re short-biased: There’s no valid short setup yet. Only if the price fails at $192–$194 with a reversal candle should you consider a short-term fade. Until then, trend is your friend.
📢 Fundamental Triggers to Watch for GOOGL
- Earnings Report – July 30
GOOGL reports next week, and this run-up may be pricing in strong Q2 results. EPS and YouTube/ad segment growth will be in focus. - AI & Cloud Revenue Growth
Any updates on Google Cloud profitability or Gemini AI traction could significantly affect investor sentiment. - Macroeconomic Conditions
CPI and Fed language will drive tech sector strength. If yields rise aggressively, GOOGL may cool off with the broader NASDAQ. - Antitrust Headlines or DOJ Moves
Watch for any legal/regulatory developments, which can temporarily weigh on sentiment. - Institutional Rotation Into Mega Caps
GOOGL has become a key safety trade for funds rotating out of riskier AI bets — this institutional demand may continue short term.
🧠 Final Thoughts: GOOGL Price Outlook
- Outlook: Bullish with potential short-term exhaustion
- Bias: Long above $188, breakout above $194.75
- Setup Watch: Look for continuation above the 52-week high or retracement into $188 with a bounce
- Risk Level: Moderate — trending cleanly, but overextended near resistance
💡 My trader take:
“This is a textbook momentum setup into resistance. The question isn’t if GOOGL pulls back — it’s when. If volume stays healthy and we break above $194.75, I expect follow-through toward $198+. But if we reject up here with a bearish engulfing or doji, I’ll wait to reload near $186–$188.”
🔁 Recap for Traders
- 🔥 Trend is strong, momentum is healthy
- 🚀 Eyes on $194.75 breakout or $188–$186 support retest
- 📆 Earnings next week will likely be the catalyst for the next big move
- ⚠️ Avoid shorting this strength unless a real reversal shows up

