Alphabet Inc. (GOOG) Stock Analysis – July 24, 2025: Buy or Bail?
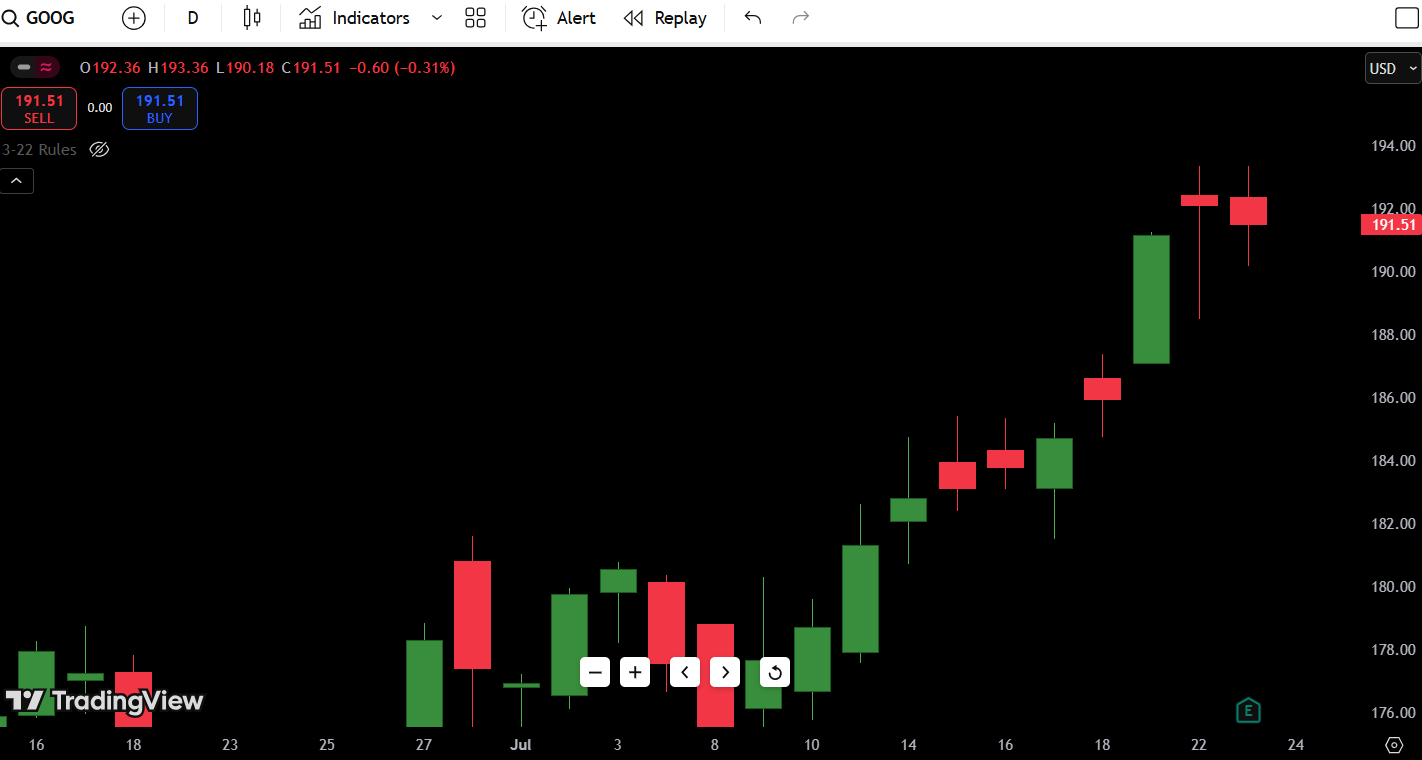
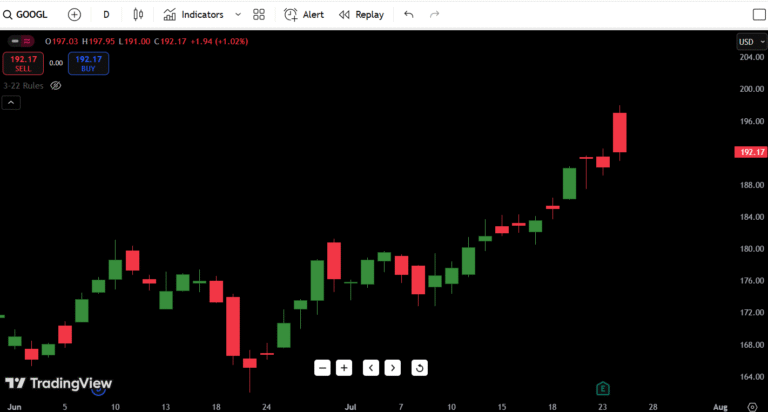
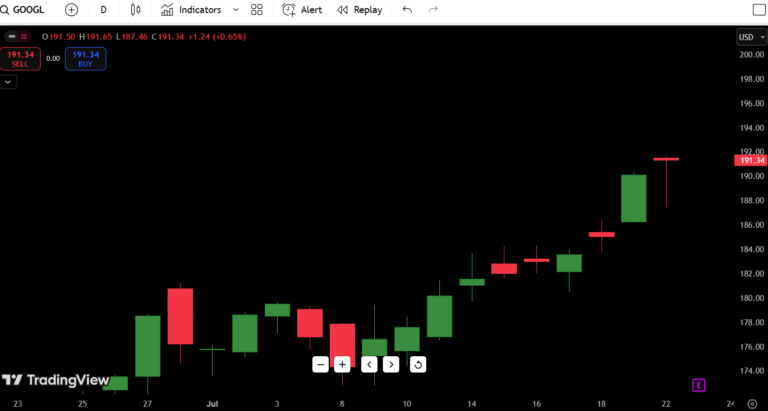
As of July 24, 2025, Alphabet Inc. (GOOG) is trading at $191.51, slightly down on the day after a multi-session run that pushed it to fresh short-term highs. The stock is showing strong bullish structure, but today’s mild pullback might be the first red flag for bulls if momentum stalls.
- Google Current Price: $191.51
- Daily Direction: Bullish Bias (short-term), but cooling
- July 24, 2025 GOOG Stock Forecast: Watch for reaction at $193–$194
- 52-Week High and Low: $193.75 / $115.33
- Support Zone: $188.00–$189.20
- Resistance Zone: $193.36–$194.50
One critical observation: GOOG just printed its second consecutive red candle after a sharp multi-day climb. This could either be a healthy consolidation — or an early signal of a bull trap at the top of a rising wedge. Traders should stay alert.
- Must read My Previous Day : Alphabet Inc. (GOOG) Stock Analysis
Contents
Candlestick Chart Analysis
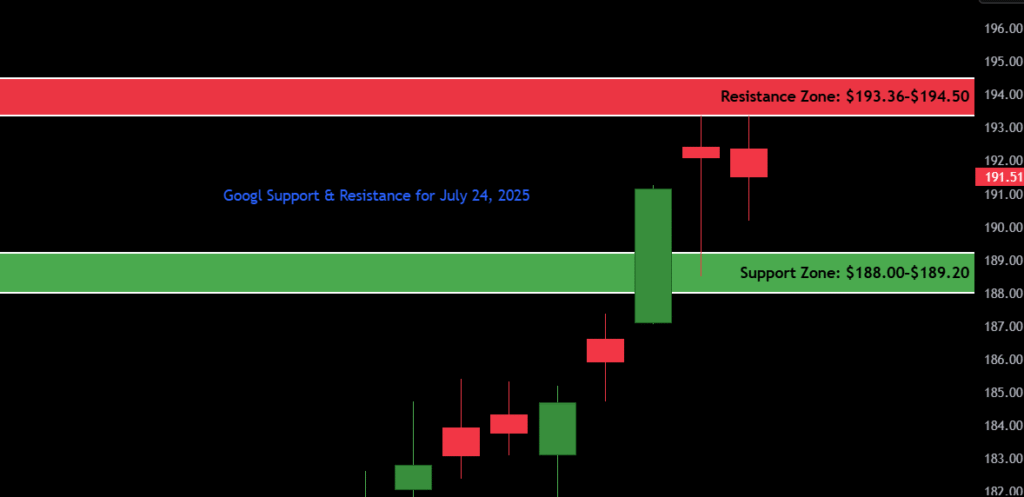
Let’s break down what the GOOG candlestick chart is telling us right now.
- Trend Structure: The trend has clearly shifted bullish since early July. GOOG pushed through a prolonged base near $175 and has been stair-stepping higher ever since.
- Recent Pattern Behavior:
- A massive bullish marubozu candle (July 22) created a breakout push, confirming momentum.
- The next two candles (July 23–24) are small-bodied red candles, suggesting stalling momentum right at the $193.36 resistance zone.
- Today’s high was $193.36, aligning exactly with that zone — and it rejected again. Not a coincidence.
- Volume Insight: Volume on the breakout day was heavy — but these last two sessions? Volume has dried up. That’s a warning sign for bulls who entered late.
- Market Psychology Insight:
This is classic exhaustion zone behavior — strong run-up, followed by indecision candles near resistance, possibly trapping late buyers. If it fails to reclaim $193+ on volume, a quick retest of $188–$189 could be in play.
Unless a strong buyer steps in quickly, we could be seeing a lower high setting up — especially if the stock dips under $190 tomorrow.
Support and Resistance Levels Table
| Type | Price Level | Description |
|---|---|---|
| Resistance 1 | $193.36 | Today’s high, key rejection zone |
| Resistance 2 | $194.50 | Pre-gap supply zone (early April) |
| Resistance 3 | $198.75 | Next fib extension zone |
| Resistance 4 | $205.30 | 52-week high |
| Support 1 | $189.20 | Bullish demand wick from July 23 |
| Support 2 | $188.00 | Micro pullback base |
| Support 3 | $183.90 | Structure support from July 18 |
| Support 4 | $176.20 | Key base from consolidation zone |
$193.36 is the most important level right now. If GOOG can’t clear it with conviction, bulls risk getting trapped in a failed breakout setup.
7-Day Price Forecast Table
| Date | High | Low | Expected Close |
|---|---|---|---|
| July 24 | $193.36 | $190.18 | $191.51 |
| July 25 | $192.80 | $188.60 | $189.90 |
| July 26 | $191.10 | $187.70 | $188.80 |
| July 27 | $190.30 | $186.50 | $187.40 |
| July 28 | $188.50 | $185.00 | $186.30 |
| July 29 | $190.00 | $186.50 | $188.90 |
| July 30 | $192.60 | $189.00 | $191.20 |
Forecast Logic:
The chart shows momentum slowing at resistance. If GOOG holds above $188.00 with support buyers stepping in, we could see another attempt at $193–$194 mid-next week. But if $188 cracks, we’re likely looking at a test of $183–$184 by week’s end.
Buy, Hold, or Sell Decision Table
| Action | Trigger Condition | Reasoning |
|---|---|---|
| BUY | Close above $194.00 | Clear breakout beyond rejection zone |
| HOLD | Range between $188–$193 | Chop zone, needs confirmation |
| SELL | Break below $188.00 | Bearish reversal confirmed |
Buy Scenario:
If GOOG cleanly breaks above $194.00 with increasing volume, it will confirm a breakout from the current range and open the path toward $198–$200+ in the near term.
Hold Zone:
Traders should wait if GOOG continues to trade between $188–$193. It’s a decision zone. The market could go either way depending on volume and macro headlines.
Sell Signal:
If we get a daily close below $188.00, that would invalidate the bullish structure, especially if the move comes on strong selling volume. Expect quick downside to $183–$184 in that case.
Fundamental Triggers
Here’s what could shake up GOOG in the coming week:
- Q2 Earnings Report (Expected Next Week)
This is the big one. Wall Street is expecting strong performance from Google’s advertising business, but any slowdown — especially in YouTube or Cloud — could spark a correction. - Tech Sector Sentiment
Alphabet is part of the mega-cap tech complex. If we see weakness in peers like MSFT or AAPL, it can drag GOOG down too. Conversely, sector-wide strength could boost the breakout chances. - Macro Data & Fed Tone
If the Fed leans more hawkish in upcoming minutes or speeches, growth stocks like GOOG could face pressure. A dovish tilt could support risk-on moves. - AI Newsflow
Any updates related to Google’s AI models, Gemini rollout, or regulatory scrutiny in the EU/US could impact short-term sentiment. - Institutional Activity
Look for signs of rotation in and out of Big Tech as hedge funds rebalance ahead of earnings season. The current low-volume grind might reflect this.
Final Thoughts
Outlook: Cautiously Bullish with a Risk of Reversal
Key Levels to Watch:
- Breakout Trigger: $194.00+
- Breakdown Trigger: $188.00
- Short-Term Target (Bullish): $198–$200
- Pullback Target (Bearish): $183–$184
This chart looks like a textbook bullish impulse followed by consolidation, but the low-volume rejection candles at $193.36 tell us to be cautious. If GOOG can’t reclaim that level by Tuesday, we might be watching a short-term top in the making.
My Personal Trader Insight:
This looks like one of those setups where breakout traders could get trapped if they rush in above $192 without confirmation. In my experience, when a big tech name pushes into prior supply on fading volume, it often results in a mini rug pull — not a crash, but enough to shake out weak hands.
That said, if the stock bases above $188 and we get a breakout with volume, it could rip toward $200+ very quickly. Just don’t front-run the move. Let price prove itself.

