GameStop (GME) Stock Analysis – July 22, 2025
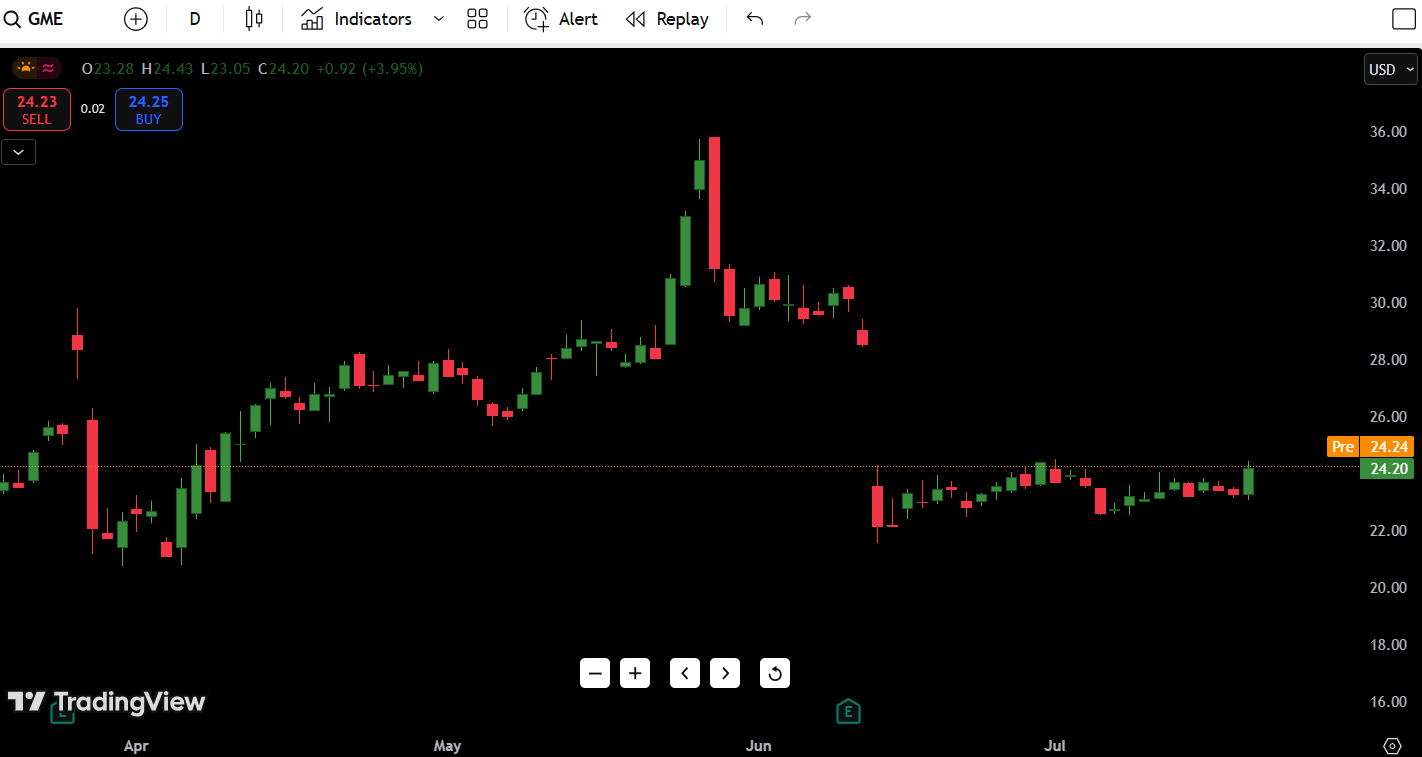
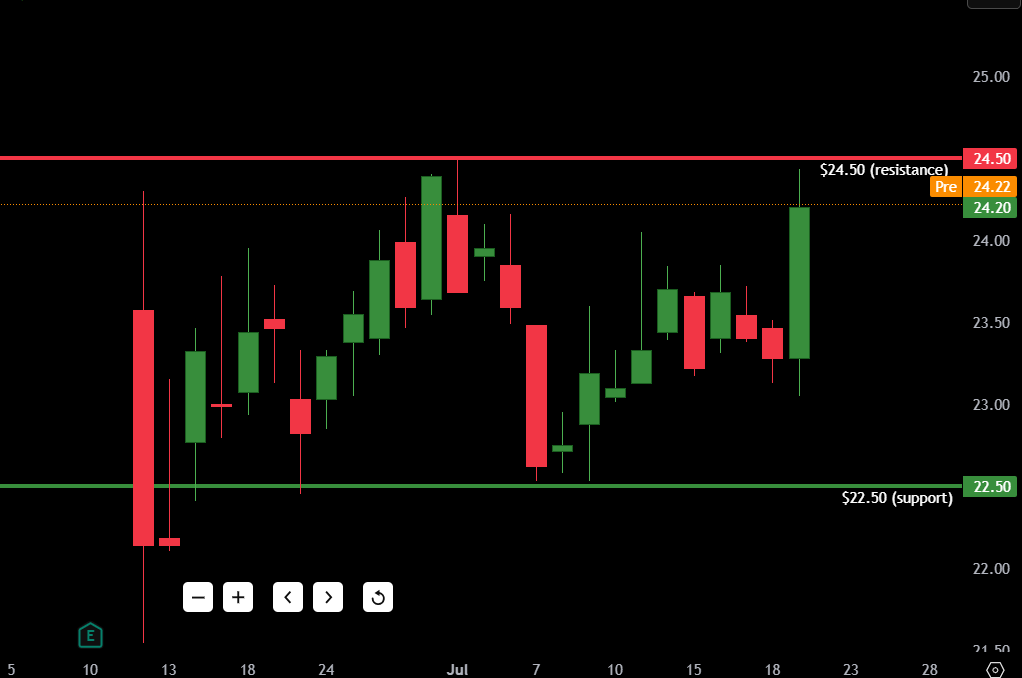
As of July 22, 2025, GameStop (GME) is trading at $24.20, up 3.95% on the day after holding its consolidation range for nearly six weeks. Today’s bullish candle stands out as the largest green bar since mid-June, signaling potential accumulation and a breakout brewing above the $24.50 resistance.
GME’s 52-week high is $36.90, while the 52-week low sits at $10.76. The most crucial levels right now? $24.50 (resistance) and $22.50 (support) — a break in either direction could spark aggressive volatility.
Contents
Candlestick Chart Analysis
Let’s break down the recent price action using the daily candlestick chart.
Trend: Neutral to Bullish
Since the sharp sell-off in early June, GME has been range-bound between $22 and $25, forming a classic base structure after a sharp move down. This tight coil often precedes high-volatility moves.
Recent Candlestick Behavior:
- Today’s candle is a strong full-bodied green bar, engulfing multiple previous days’ price action, a bullish engulfing pattern off a key support zone.
- Low-wick structure suggests buyers were in control all session, pushing the stock near session highs at $24.43.
Volume Observation:
- Volume is gradually increasing, especially compared to the sleepy sessions throughout early July.
- A volume spike on a move above $24.50 could confirm a breakout and attract momentum traders.
Market Structure:
- GME is attempting to break out of a low-volume node in the $24–$25 zone.
- A close above $24.50 would break the multi-week range, creating room toward $27–$30 liquidity levels from May.
Support and Resistance Levels
| Type | Price Level | Description |
|---|---|---|
| Resistance 1 | $24.50 | Key breakout level, range top |
| Resistance 2 | $27.80 | Mid-May gap zone |
| Resistance 3 | $30.50 | Swing high from May 15 |
| Resistance 4 | $36.90 | 52-week high |
| Support 1 | $22.50 | Range low, demand zone |
| Support 2 | $21.00 | Last bullish reversal |
| Support 3 | $19.40 | Late April base level |
| Support 4 | $10.76 | 52-week low |
Key Level to Watch: A close above $24.50 opens the door for a fresh move toward $27+. A failure here could send GME back toward $22.50.
7-Day Price Forecast
Based on the current setup and bullish candle confirmation, here’s the 7-day forecast:
| Date | High | Low | Expected Close |
|---|---|---|---|
| Day 1 | $24.80 | $23.70 | $24.40 |
| Day 2 | $25.60 | $24.10 | $25.20 |
| Day 3 | $26.30 | $24.90 | $25.80 |
| Day 4 | $27.00 | $25.10 | $26.40 |
| Day 5 | $27.80 | $25.50 | $27.00 |
| Day 6 | $28.50 | $26.50 | $27.40 |
| Day 7 | $29.20 | $26.80 | $28.30 |
⚠️ Forecast Logic: If GME holds above $24.00 and breaks $24.50 with volume, it’s positioned for a 3–5 day continuation push toward $27–$30. Rejection or failure to hold $23.70 invalidates this scenario short-term.
Buy, Hold, or Sell Decision Table
| Action | Trigger Condition | Reasoning |
|---|---|---|
| BUY | Close above $24.50 | Breakout confirmed with volume |
| HOLD | Between $22.50–$24.50 | Sideways, base-building behavior |
| SELL | Break below $22.50 | Bearish breakdown into demand void |
Current CTA: BUY (Speculative Breakout)
If you’re a swing trader with risk appetite, a break and close above $24.50 offers a favorable risk/reward entry. Stop could be placed just below $23.50, targeting the $27.80–$30.50 zone.
If you’re holding from lower, continue to hold until $22.50 fails — that’s your invalidation zone.
Fundamental Triggers
While the current setup is heavily technically driven, several macro and fundamental factors could influence GME:
- Next Earnings Date: August 2025 – volatility typically rises 2 weeks prior.
- Short Interest Activity: GME remains a heavily shorted name, and any retail/institutional buying spike can trigger short squeezes.
- Keith Gill/Roaring Kitty Mentions: Historically, even a tweet or appearance from him has caused massive volume surges.
- Market Sentiment: Broader risk-on sentiment can lift meme stocks like GME alongside small-cap rallies.
7. Final Thoughts
- Outlook: Cautiously Bullish
- Breakout Watch Level: $24.50
- Risk Invalidation Level: Below $22.50
GME is at a make-or-break moment.
If bulls can follow through above $24.50, the technical breakout aligns with short-term bullish sentiment, possibly targeting $27.80 or higher. However, volume confirmation is critical — otherwise, this could turn into another fakeout trap.
Trader’s Take: “In my experience, tight sideways bases like this often precede explosive moves. But you need volume to trust the breakout. I’ll personally look for a breakout day close above $24.50 with above-average volume to scale in long.”

