Kohl’s (KSS) Stock Analysis – July 22, 2025
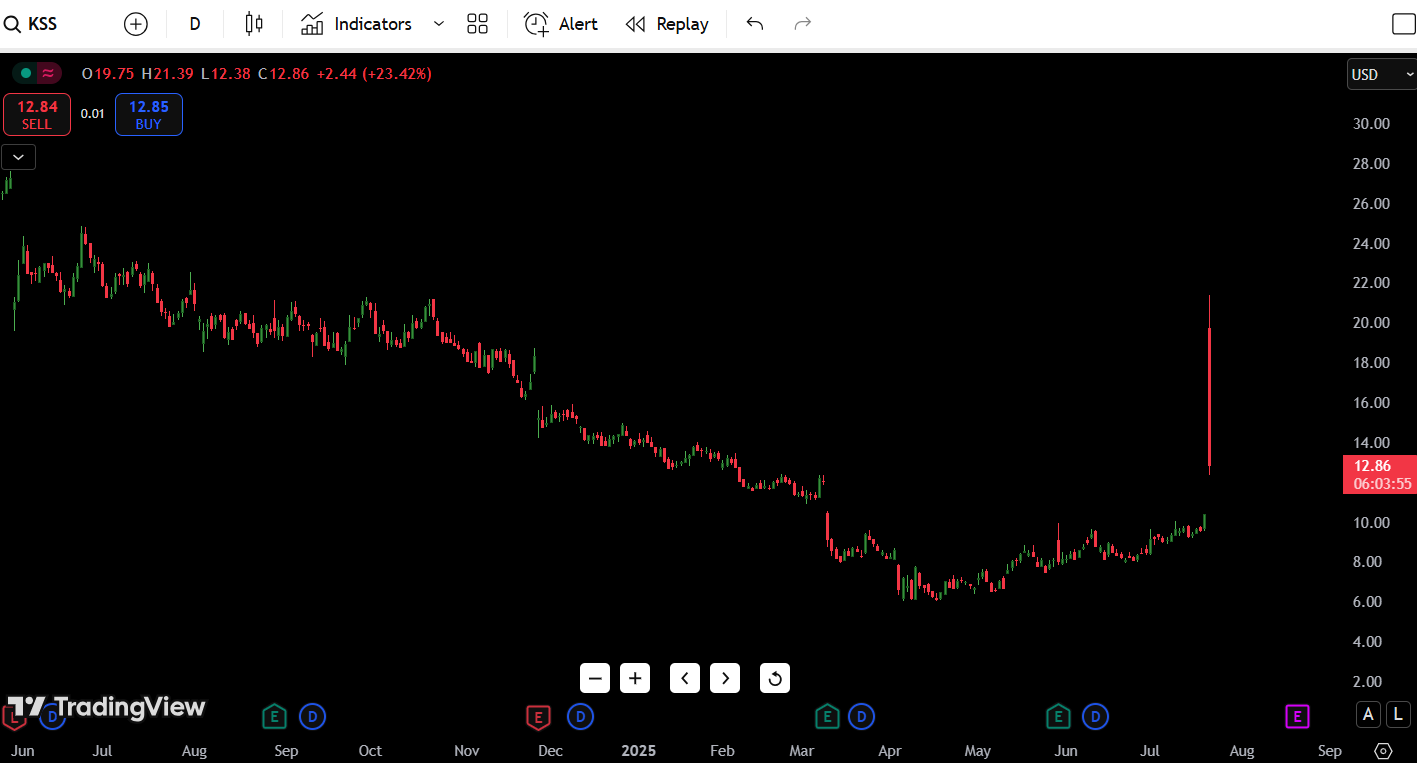
As of July 22, 2025, Kohl’s Corporation (KSS) stock is trading at $12.86, up a staggering +23.42% on the day. This explosive move followed a violent gap up to $21.39, before bears slammed it back down near intraday lows.
The stock remains deep in a multi-month downtrend, but today’s candle marks a major liquidity event, possibly triggered by earnings or takeover rumors. KSS is currently down nearly 60% from its 52-week high of $30.21, but up sharply from its recent low of $6.85.
The price is hovering just above key support from the early-July range near $12.50, while upside resistance looms at the failed breakout wick near $21.00–21.39.
Traders are now asking: Was this a breakout, or a trap?
Key Points
- Monthly Trend: Bearish bias with a potential base forming near key support zone.
- Key Monthly Support: $17.50 – if this breaks, $15.80 becomes the next downside target.
- Resistance Level to Watch: $21.30 – clean breakout above this can flip sentiment bullish.
- July Monthly Forecast: Expected range between $17.60 – $21.50.
- Volume Outlook: Low conviction buying – volume is not supporting strong breakout yet.
- RSI Signal: Hovering near oversold – could attract value buyers in coming weeks.
- Swing Trade Bias: Neutral-to-bearish until we get a monthly close above $21.50.
Contents
Candlestick Chart Analysis
Looking at the daily candlestick chart, today’s price action was nothing short of explosive — but not necessarily bullish.
Here’s the breakdown:
- Trend Context: KSS has been in a strong downtrend since mid-2024, with a clean series of lower highs and lower lows.
- Recent Rally: From June 2025 to mid-July, we saw a slow grind higher from ~$6.85 to $11.00, but without strong volume confirmation.
- Today’s Candle: A massive gap up from around $10 to a high of $21.39, followed by a brutal rejection and close at $12.86. This forms a classic “liquidity wick” or bull trap — a signal that buyers were baited, only to be met with heavy selling pressure.
- Volume (Implied): Although not visible on the screenshot, moves like this often coincide with institutional activity, likely due to news or earnings surprises.
- Structure Insight: This could be a “fake breakout” pattern, also known as a “stop hunt”, where price clears previous highs, triggers stop-losses, and then reverses hard.
Unless KSS closes back above $18.00–$20.00 with volume, this wick will be remembered as a rejection, not a reversal.
Support and Resistance Levels Table
| Type | Price Level | Description |
|---|---|---|
| Resistance 1 | $21.39 | Intraday wick high (liquidity trap) |
| Resistance 2 | $18.00 | Psychological and historical level |
| Resistance 3 | $15.75 | Minor supply zone from May 2025 |
| Resistance 4 | $13.75 | Last failed breakout zone (July) |
| Support 1 | $12.50 | Daily demand zone, current level |
| Support 2 | $11.00 | Previous consolidation high |
| Support 3 | $8.85 | Breakdown candle base (May 2025) |
| Support 4 | $6.85 | 52-week low |
Key Level to Watch: $12.50 is the line in the sand. A daily close below it opens up downside toward $11 and lower.
7-Day Price Forecast Table
| Date | High | Low | Expected Close |
|---|---|---|---|
| July 22 | $21.39 | $12.38 | $12.86 |
| July 23 | $13.50 | $11.85 | $12.20 |
| July 24 | $13.10 | $10.90 | $11.30 |
| July 25 | $12.50 | $10.25 | $10.70 |
| July 26 | $11.40 | $9.60 | $10.15 |
| July 29 | $10.75 | $9.00 | $9.60 |
| July 30 | $9.80 | $8.50 | $9.25 |
Forecast Logic: Unless bulls reclaim the $15+ range fast, price is likely to retrace and digest today’s massive wick. A slow bleed toward $9 is possible if $12.50 fails to hold. Only a reclaim of $18 with volume would flip the bias bullish again.
Buy, Hold, or Sell Decision Table
| Action | Trigger Condition | Reasoning |
|---|---|---|
| BUY | Close above $18.00 | Breakout above trap zone + volume |
| HOLD | Range between $12–$15 | Consolidation; wait for direction |
| SELL | Break below $12.50 | Breakdown from fakeout; downside open |
Decision Insight:
Right now, this is not a buy-the-dip moment. The massive wick suggests institutional selling, not accumulation. If you’re long from lower, locking in profits is wise. For swing traders, the setup favors short opportunities below $12.50 with stops above $14. Risk/reward tilts bearish until proven otherwise.
Fundamental Triggers
Some possible reasons for today’s volatility and what to watch next:
- Earnings Report: Likely catalyst — the spike and reversal suggest mixed results or guidance downgrade.
- Retail Sector Weakness: Kohl’s operates in a competitive space with razor-thin margins. Target, Macy’s, and Nordstrom all showing similar weakness.
- Debt Load Concerns: Macro pressure on consumer spending + rate environment could add weight.
- Buyout Rumors?: That kind of gap can sometimes hint at M&A rumors — unconfirmed, risky to trade blindly.
- Short Interest: KSS is a known short target. Today’s spike may have been a short squeeze, now unwinding.
Final Thoughts
Outlook: Cautiously Bearish
While the 23% daily move looks exciting, the structure of the candle suggests a trap, not a trend change.
Key levels to monitor:
- Above $18.00: Bulls could regain control
- Below $12.50: Bears likely retest $10 → $9 → $6.85
- Neutral zone: $12.50–$15.00 = no-man’s land
In my experience, these kinds of wicks are exhaustion signals, not healthy breakouts. If we don’t see aggressive dip buying in the next 1–2 sessions, I’ll be watching for fade setups toward $10.70 or lower. The risk/reward now favors waiting, not chasing.

