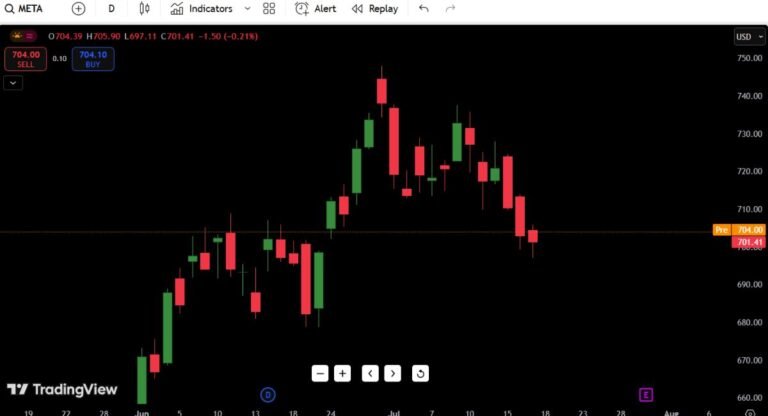
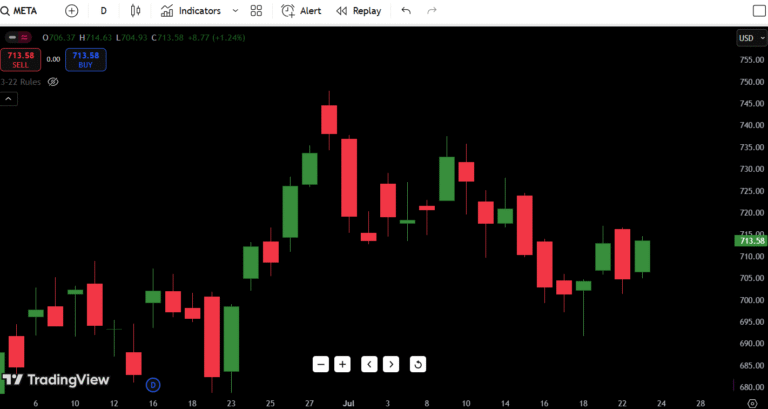
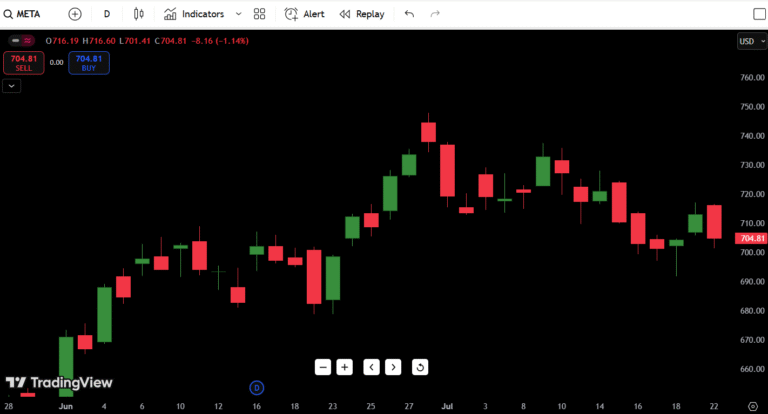
META (META) Stock Analysis – July 22, 2025
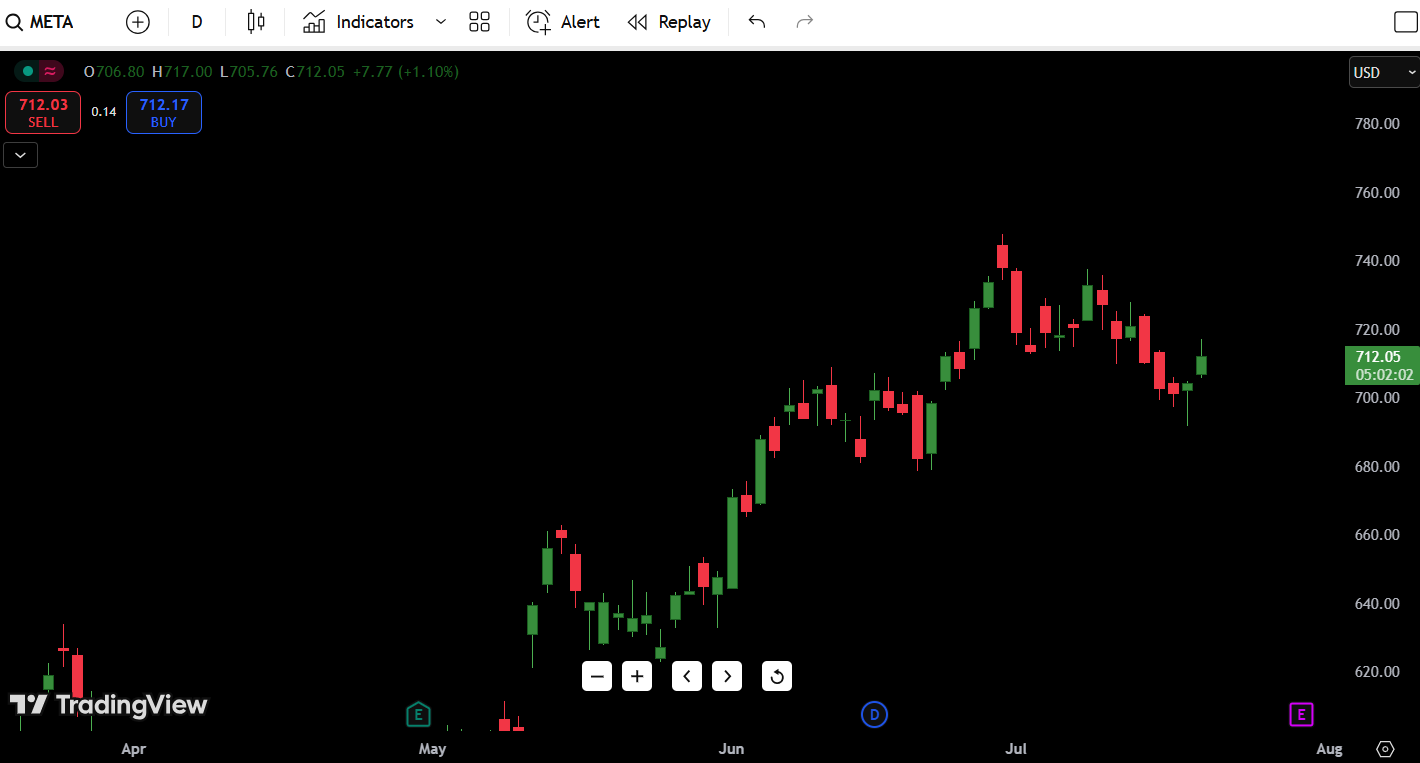
META Platforms Inc. (META) is showing early signs of a potential rebound after a brutal multi-week pullback from its June highs. As of today, META stock is trading at $712.05, up +1.10% for the session. After briefly dipping below $700 support last week, bulls stepped in aggressively, pushing the stock back above key short-term levels.
- Current Price: $712.05
- Daily Direction: Bullish reversal attempt
- 52-Week High: $780.00
- 52-Week Low: $580.00
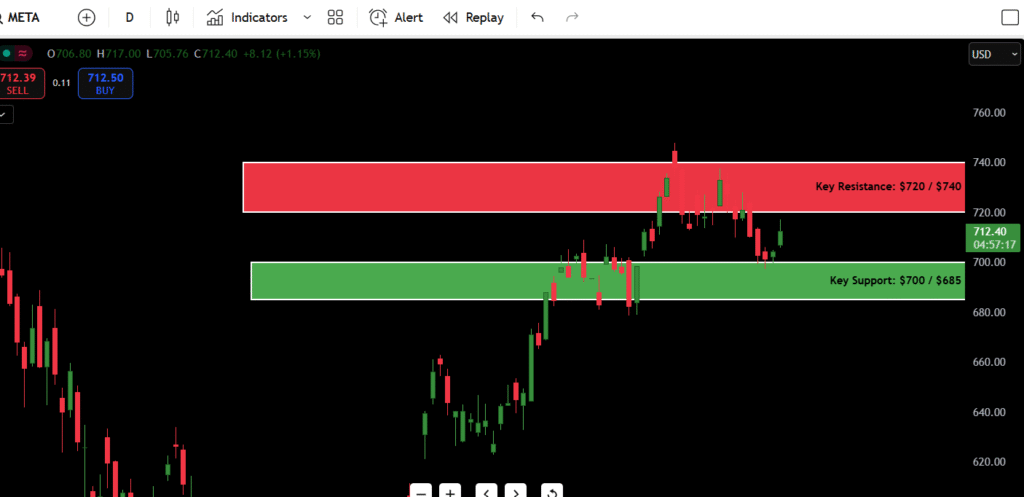
- Key Support: $700 / $685
- Key Resistance: $720 / $740
Contents
- Observation for July 22:
- Candlestick Chart Analysis for July 22 Outlook
- Trend Overview:
- Recent Candlestick Behavior:
- Market Structure:
- Volume Profile (Visual Assessment):
- Support and Resistance Levels Table
- META 7-Day Price Forecast Table (July 22 Start)
- Forecast Logic:
- Buy, Hold, or Sell Decision Table
- Current Bias:
- Fundamental Triggers
- Upcoming Events Impacting META Stock Forecast:
- Final Thoughts for July 22, 2025
- Outlook: Neutral to Slightly Bullish (Contingent on $720 Break)
- Critical Zones to Watch:
- My Trading Insight (Trader’s Perspective):
Observation for July 22:
META is attempting to reclaim short-term bullish structure after finding support near $700. However, this bounce remains fragile unless bulls can reclaim $720+ with conviction. Otherwise, this move risks fading back into recent lows.
Candlestick Chart Analysis for July 22 Outlook
Trend Overview:
META had been enjoying a strong uptrend from late April through June, carving higher highs and higher lows. However, the sharp pullback from $750 down to $700 disrupted momentum. The current action is an early-stage potential reversal or dead cat bounce.
Recent Candlestick Behavior:
- Strong green candle today reclaiming $710+ zone after last week’s weakness.
- The prior candles show hammer-like rejection wicks below $700, indicating demand.
- This week’s action resembles a possible bullish reversal attempt off demand.
Market Structure:
- Short-Term: Attempting to flip from bearish pullback to bullish recovery.
- Medium-Term: Neutral until we see acceptance back above $720–$740.
- Critical Zone: $700–$720 dictates next leg; failure = revisit $680s.
Volume Profile (Visual Assessment):
- Decent volume on today’s green candle but still lower than peak sell days.
- Volume confirmation will be key if bulls aim for $740 again.
Summary: META is at a crossroads between a genuine rebound and a relief rally. Bulls need to defend $700 and push through $720+ this week to regain confidence.
Support and Resistance Levels Table
| Type | Price Level | Description |
|---|---|---|
| Resistance 1 | $720.00 | Nearest swing resistance |
| Resistance 2 | $740.00 | Breakdown origin / minor supply |
| Resistance 3 | $750.00 | Recent swing high |
| Resistance 4 | $780.00 | 52-week high |
| Support 1 | $700.00 | Key psychological support |
| Support 2 | $685.00 | Recent demand zone |
| Support 3 | $660.00 | Breakdown risk zone |
| Support 4 | $580.00 | 52-week low |
Key Level: $700 needs to hold, $720 needs to break for bullish continuation.
META 7-Day Price Forecast Table (July 22 Start)
| Date | High | Low | Expected Close |
|---|---|---|---|
| July 22 | $720 | $705 | $712 |
| July 23 | $725 | $710 | $718 |
| July 24 | $740 | $715 | $735 |
| July 25 | $745 | $730 | $740 |
| July 26 | $740 | $715 | $728 |
| July 27 | $730 | $700 | $710 |
| July 28 | $715 | $685 | $700 |
Forecast Logic:
If META holds $705–$710 and pushes through $720+ this week, we likely see a test of $735–$740. Failure at $720 likely brings another test of $700 or even $685. Volume confirmation is crucial for trust in any upside breakout.
Buy, Hold, or Sell Decision Table
| Action | Trigger Condition | Reasoning |
|---|---|---|
| BUY | Close above $720 | Structure reclaim confirmed |
| HOLD | Range-bound $700–$720 | Rebuilding base, no clear breakout |
| SELL | Break below $700 | Rejection of bounce, back to lows |
Current Bias:
Cautious hold. The bounce off $700 is encouraging but needs confirmation. Buyers should wait for a daily close above $720 with volume to add confidently. Below $700? The risk of continued selling increases toward $685–$660.
Fundamental Triggers
Upcoming Events Impacting META Stock Forecast:
- Earnings Report: META’s earnings are on deck in early August—any forward guidance on AI, ad revenue, or Reels engagement will heavily influence sentiment.
- Sector Sentiment: Social media peers (GOOG, SNAP) earnings and ad-spend trends could impact META.
- Regulatory Risks: Ongoing scrutiny over data privacy, AI usage, and advertising ethics.
- Macro Factors: Any surprise from the Fed on rate policy or recession warnings would likely pressure high-beta tech like META.
- Analyst Revisions: Re-ratings up or down post-earnings could swing momentum sharply.
Final Thoughts for July 22, 2025
Outlook: Neutral to Slightly Bullish (Contingent on $720 Break)
META’s recent pullback appears technically healthy so far—a normal digestion phase after a big run. However, we are still in a fragile technical zone between $700–$720. This is not yet a confirmed reversal, but early signs are constructive.
Critical Zones to Watch:
- Breakout Reclaim Zone: $720+
- Must-Hold Support: $700
- Failure Risk Zone: $685–$660
My Trading Insight (Trader’s Perspective):
In my experience, after sharp pullbacks like this, stocks either break out fast from reclaim zones ($720+) or they fail back into lows swiftly. META is showing early promise—but until volume drives us over $720+, this could still be a bear trap bounce.
If META closes strong over $720–$725, I’d expect a push to $740+ this week. If we roll over under $700 again? Risk opens to a deeper retrace into the mid-$600s.
Patience matters here—let price confirm.

