Meta Platforms (META) Stock Analysis – July 23, 2025
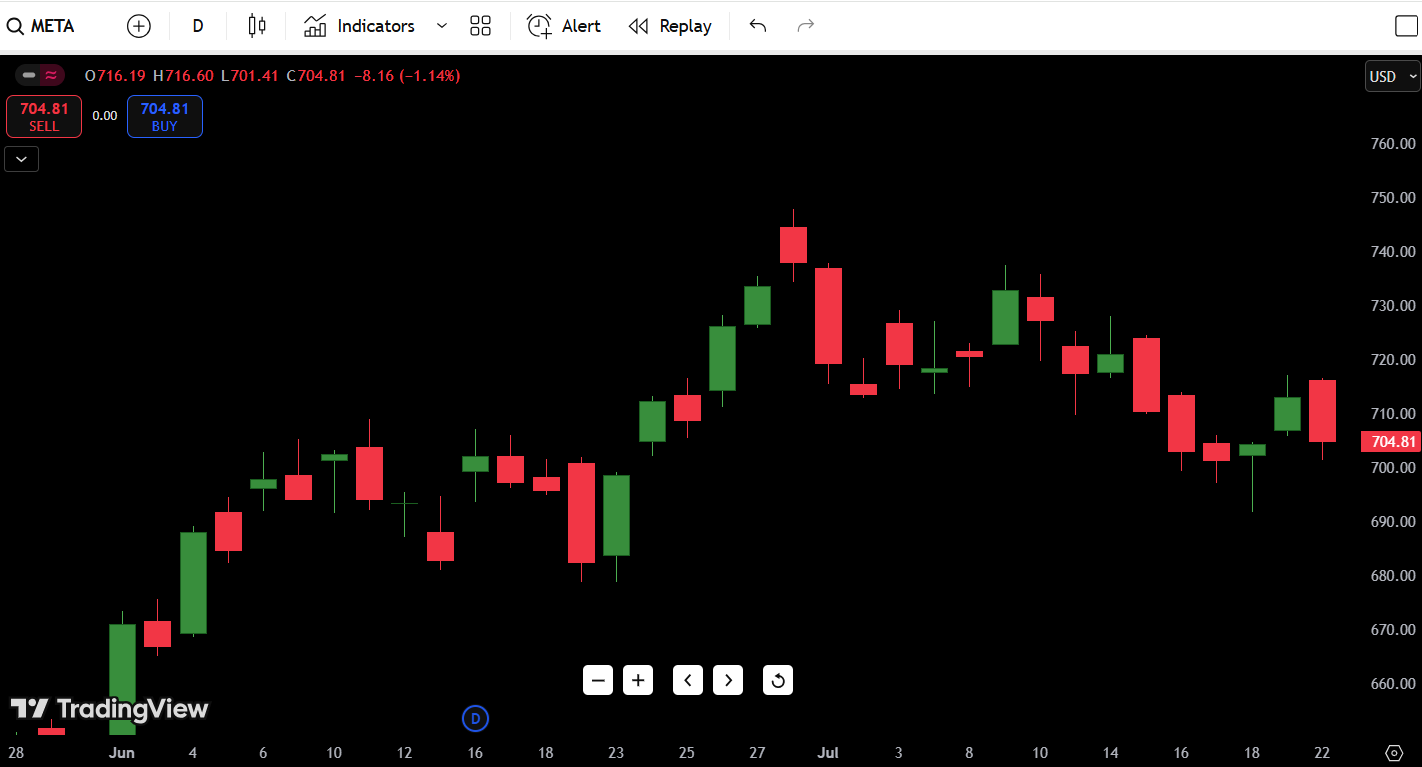
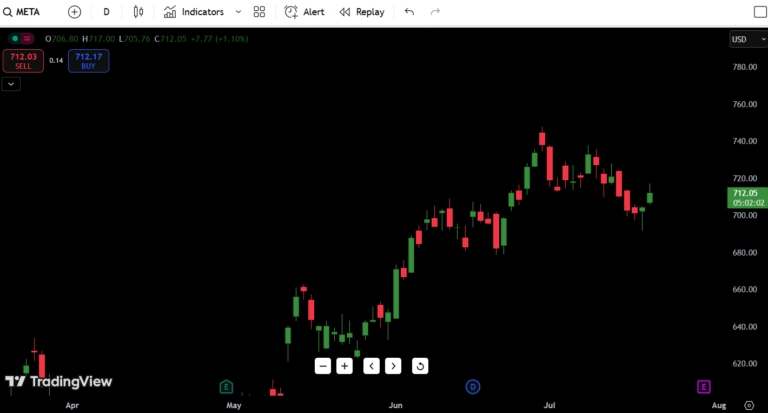
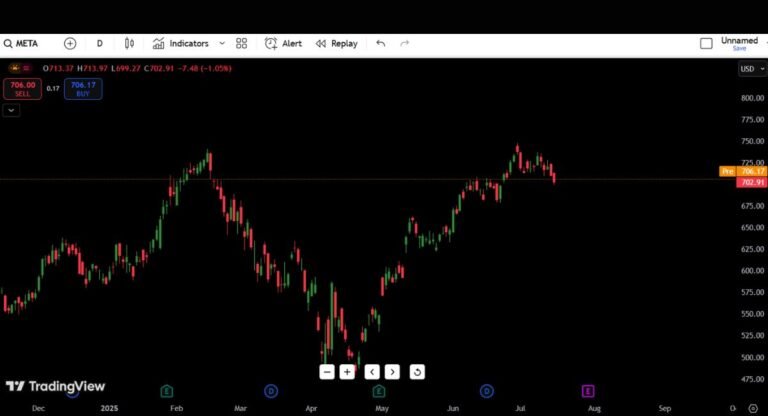
As of July 23, Meta Platforms (META) is trading at $704.81, down 1.14% on the day. The stock has been steadily pulling back from a recent high of $740.00 and now sits near a key short-term support zone between $700 and $710.
- Meta stock price on July 23: $704.81
- META Stock Forecast Today: Cautious bearish bias unless support holds
- Daily Direction: Bearish
- 52-Week High: $787.65
- 52-Week Low: $285.32
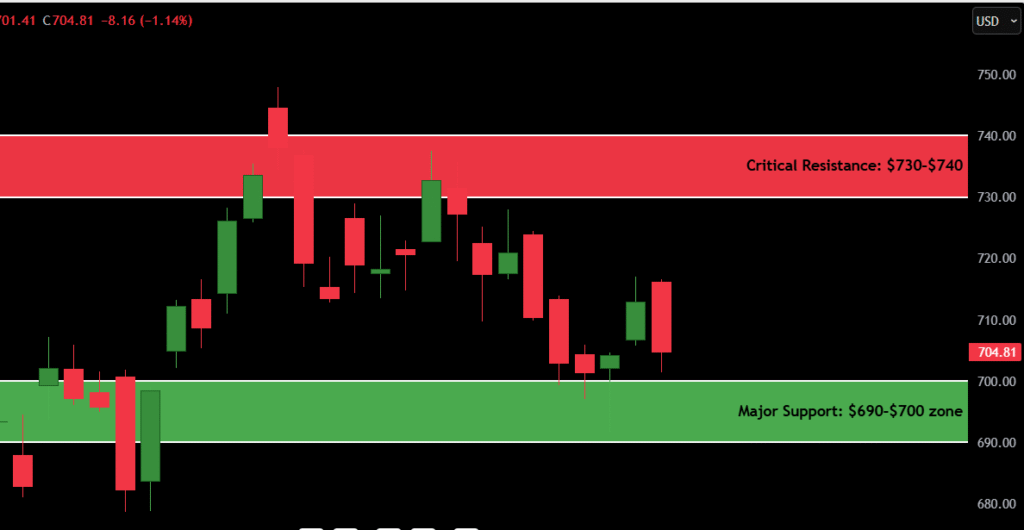
- Critical Resistance: $730–$740
- Major Support: $690–$700 zone
META’s candlestick chart today shows clear weakness. After several failed attempts to break higher, buyers are starting to lose control — and short-term bears are beginning to test the waters again.
Contents
Candlestick Chart Analysis: META Price Action Today
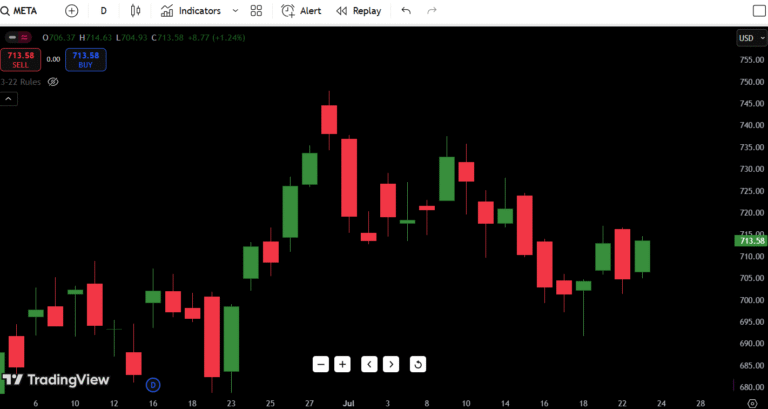
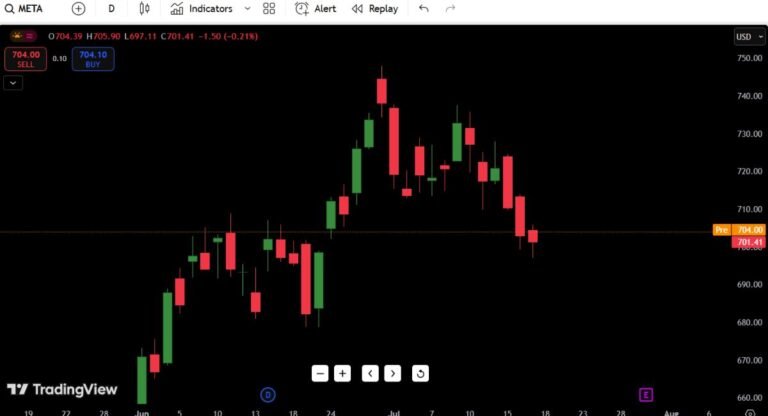
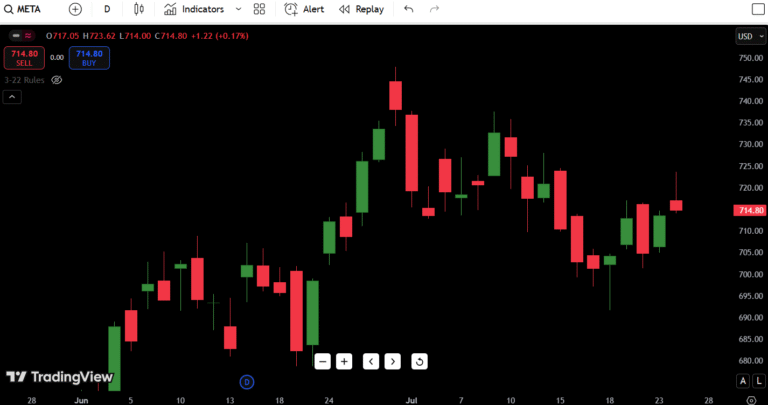
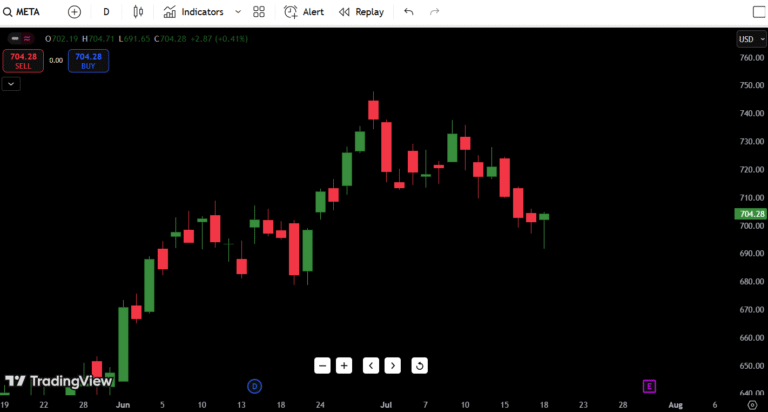
The META candlestick chart as of July 23 paints a clear picture of exhaustion and weakness:
- Trend: META is in a near-term downtrend, with lower highs forming after peaking at ~$740 in early July.
- Pattern: Today’s candle is a large-bodied red bar closing near the day’s low — classic bearish continuation. This follows a series of indecisive candles and failed bullish pushes.
- Volume: While volume isn’t shown in this snapshot, the size and structure of the candle imply seller strength and a possible uptick in bearish momentum.
- Structure: The chart shows a failed retest of $720, followed by steady selling. Recent attempts to bounce off $700 have been weak and short-lived.
This isn’t a crash — it’s a controlled pullback. But if META breaks below $700 with conviction, the next leg lower toward $680 or even $660 could accelerate quickly.
META Support and Resistance Levels Table
| Type | Price Level | Description |
|---|---|---|
| Resistance 1 | $715 | Minor supply area from July 22 |
| Resistance 2 | $730 | Lower high and failed breakout zone |
| Resistance 3 | $740 | Recent swing high |
| Resistance 4 | $765 | Previous gap-fill and trendline |
| Support 1 | $700 | Psychological + recent bounce |
| Support 2 | $690 | Pre-breakout base from June |
| Support 3 | $660 | Breakdown target |
| Support 4 | $620 | 50% retracement of 2024–2025 move |
Key level to watch: $700. A daily close below it flips the script short-term.
META 7-Day Price Forecast
| Date | High | Low | Expected Close |
|---|---|---|---|
| Day 1 (7/24) | $710 | $695 | $702 |
| Day 2 (7/25) | $708 | $690 | $695 |
| Day 3 (7/26) | $700 | $685 | $692 |
| Day 4 (7/27) | $705 | $690 | $699 |
| Day 5 (7/28) | $715 | $695 | $710 |
| Day 6 (7/29) | $720 | $705 | $718 |
| Day 7 (7/30) | $728 | $710 | $725 |
Forecast logic:
If META can defend the $690–$700 support zone, it may attempt a slow climb back toward $720+. However, if it breaks down below $690, the stock could spiral into a bearish acceleration toward $660 support, especially if broader tech weakens.
Buy, Hold, or Sell Decision Table
| Action | Trigger Condition | Reasoning |
|---|---|---|
| BUY | Close above $730 | Breakout above lower high confirms strength |
| HOLD | Range between $690–$715 | Sideways chop – wait for confirmation |
| SELL | Break below $690 | Breakdown from structure + fresh lows |
Trading Decision Breakdown:
For now, META is a hold or light sell into bounces unless it reclaims $730. The $700–$690 zone has acted as a magnet for price, and bulls have failed to push back convincingly. If the market remains weak or tech underperforms, short setups below $690 become attractive with a first target around $660.
Fundamental Triggers to Watch
These macro and company-specific catalysts could impact META’s next big move:
- Upcoming Earnings: Meta is expected to report Q2 earnings on July 31 – major volatility event
- Advertising Revenue Trends: Meta’s ad business is highly cyclical and sensitive to macro slowdowns
- AI Expansion News: Any updates about LLaMA or AI monetization could reignite bullish sentiment
- Market-wide Tech Rotation: If tech continues to lag after the recent AI hype, META could follow NVDA and TSLA into deeper pullbacks
- Interest Rate Sentiment: Watch for commentary from Fed speakers, as higher rates could hit growth stocks
Final Thoughts: META Buy or Sell Today?
Outlook: Slightly bearish near-term, but cautiously optimistic if support holds.
- If META holds above $700 and earnings deliver, bulls may reclaim $730+ and aim for a fresh attempt toward $740–$750.
- If it fails to hold $690, sellers could target the $660 zone, which aligns with a previous liquidity pocket and fib retracement.
- This isn’t a high-conviction breakout yet — and the chart suggests a pause or pullback, not immediate momentum.
My insight as a trader:
“I’ve seen this setup dozens of times — it looks like a cooling-off phase after a parabolic leg. Unless META snaps back above $715–$720 quickly, I’ll avoid going long until we retest either $690 or $660 with strong reversal candles.”

