Meta Platforms (META) Stock Analysis – July 21, 2025
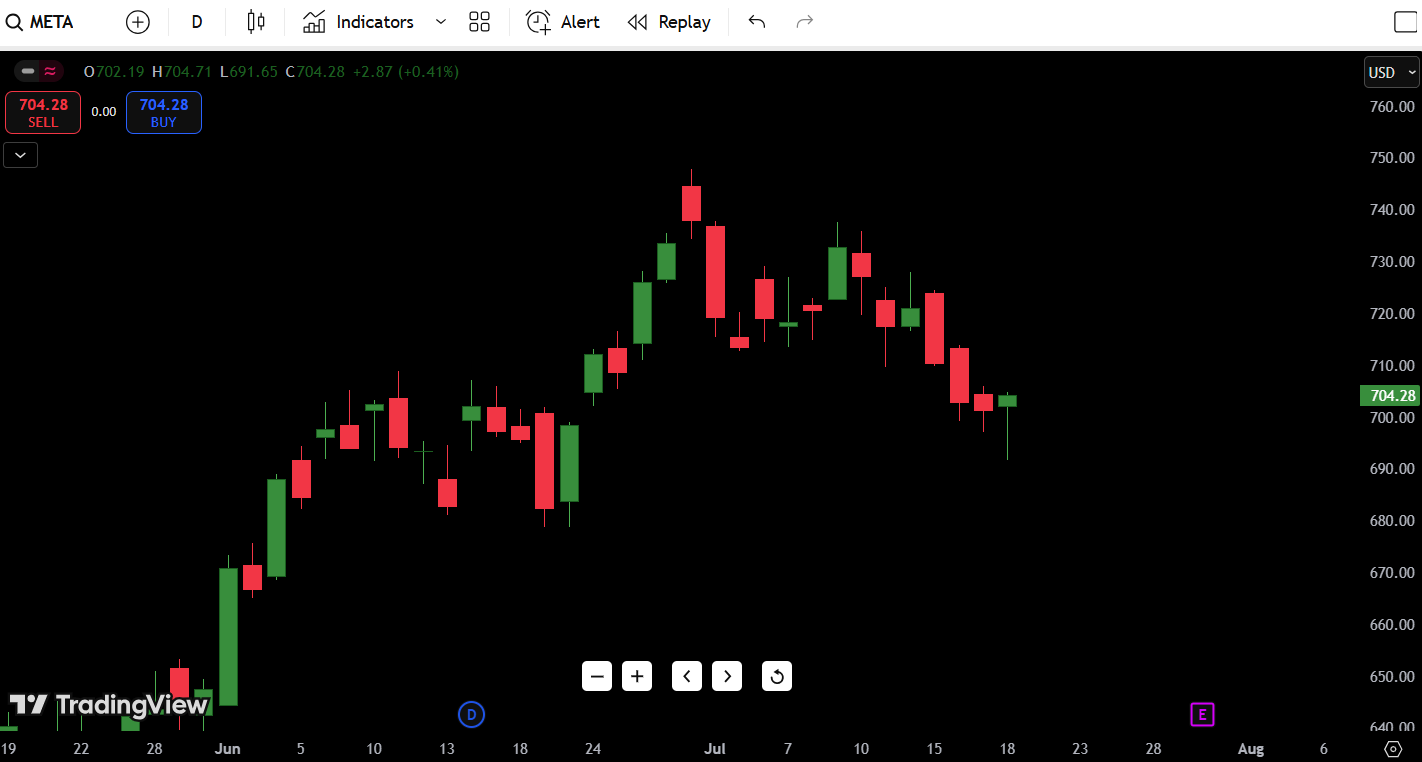
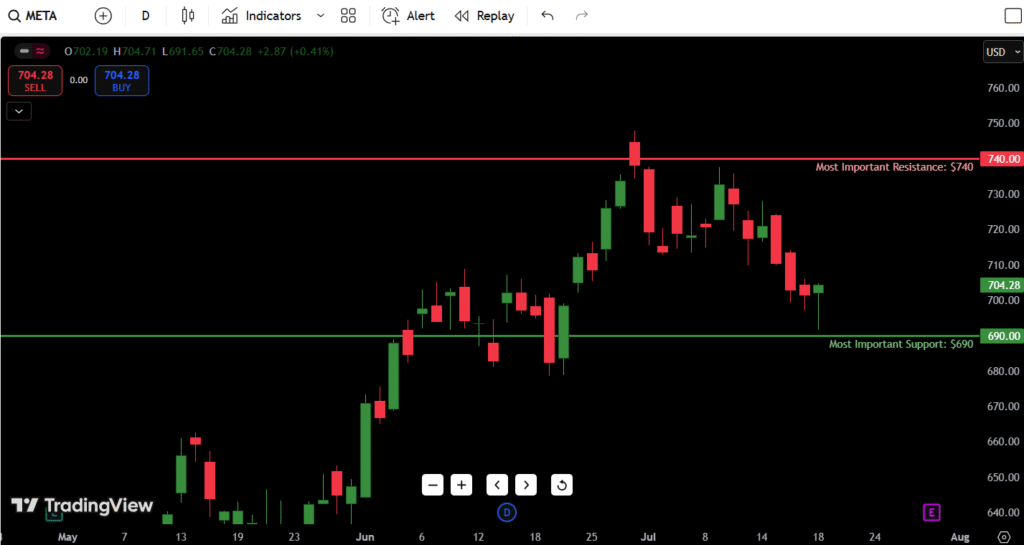
As of today, Meta Platforms (META) is trading at $704.28, recovering slightly after a choppy session. The stock closed +0.41% higher on the day, but the recent trend remains under pressure after a clear rejection from the $760 zone earlier this month.
Contents
- Key Data (As of July 21, 2025):
- Candlestick Chart Analysis – META Price Action Breakdown
- Overall Structure:
- Recent Candlestick Patterns:
- Volume Behavior:
- Indicators Insight:
- Market Structure Notes:
- META Support and Resistance Levels Table
- 7-Day Price Forecast Table
- Forecast Logic:
- Meta Buy, Hold, or Sell Decision Table
- Trading Decision Explanation:
- Fundamental Triggers for META Stock
- Upcoming Events to Watch:
- Final Thoughts on META Stock
- Outlook: Cautious Bearish Until Reclaim of $720
- Potential Setups:
- Personal Trader Insight:
Key Data (As of July 21, 2025):
- Current Price: $704.28
- Daily Direction: Neutral-to-Weak Bullish (slight rebound but still within downtrend structure)
- 52-Week High: $760.40
- 52-Week Low: $472.10
- Most Important Support: $690
- Most Important Resistance: $740
Critical Observation: After multiple failed attempts to reclaim $730+, META is sitting on a knife’s edge near key short-term support between $690 and $700. Bulls need to defend this zone hard or risk another leg down.
Candlestick Chart Analysis – META Price Action Breakdown
Let’s break this down like any trader watching the daily chart on TradingView:
Overall Structure:
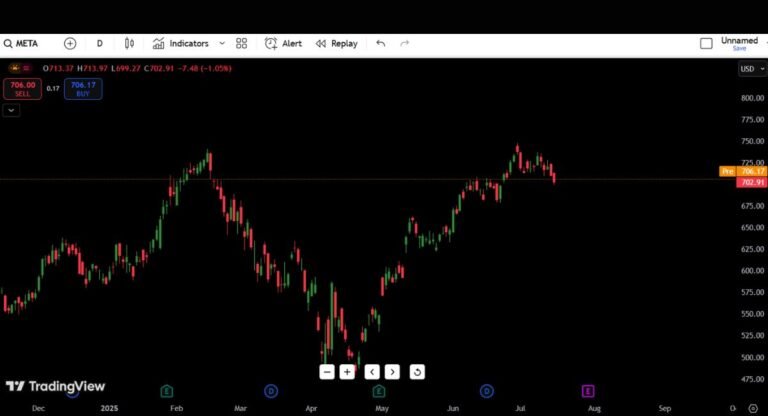
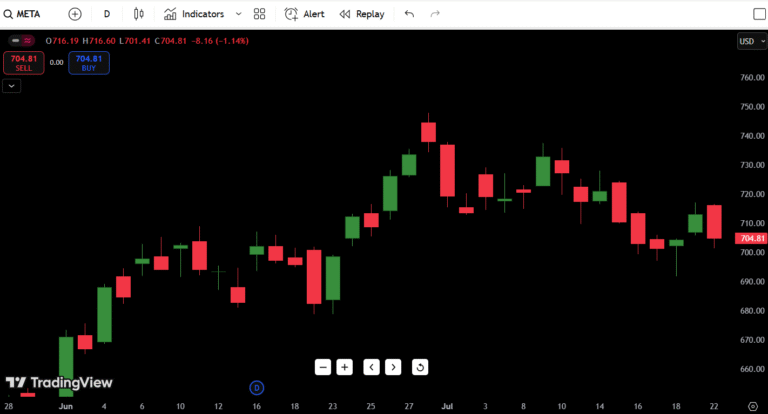
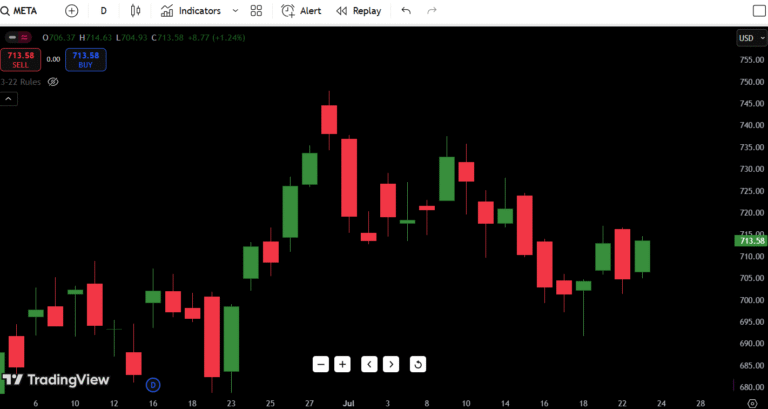
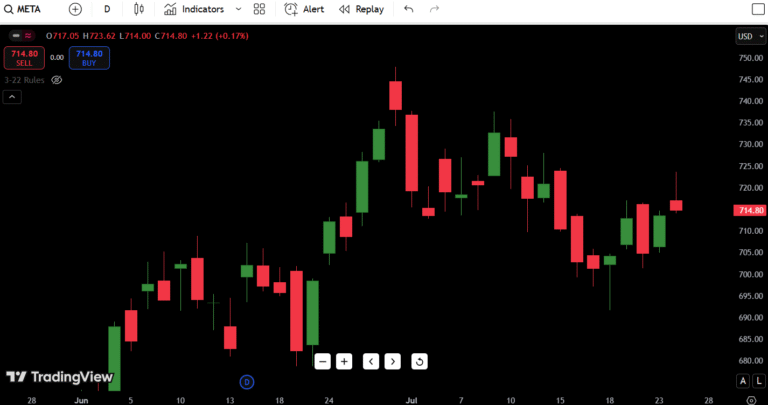
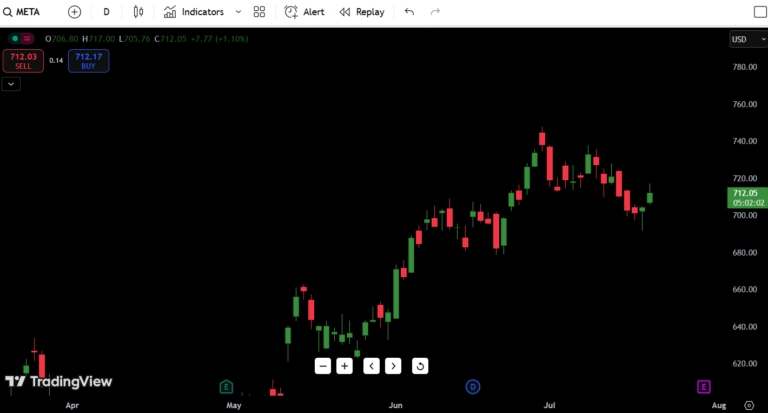
META stock is currently pulling back after a strong multi-month uptrend that peaked near $760. The price action since late June shows a clear lower high and lower low structure, signaling a short-term downtrend within a larger bullish macro trend.
Recent Candlestick Patterns:
- July 18-19: Small-bodied candles with wicks on both ends, showing indecision and a battle between buyers and sellers at $700.
- July 21: A minor green candle pushing price back to $704.28, but volume is uninspiring—this looks more like a dead cat bounce attempt unless bulls reclaim $710+ fast.
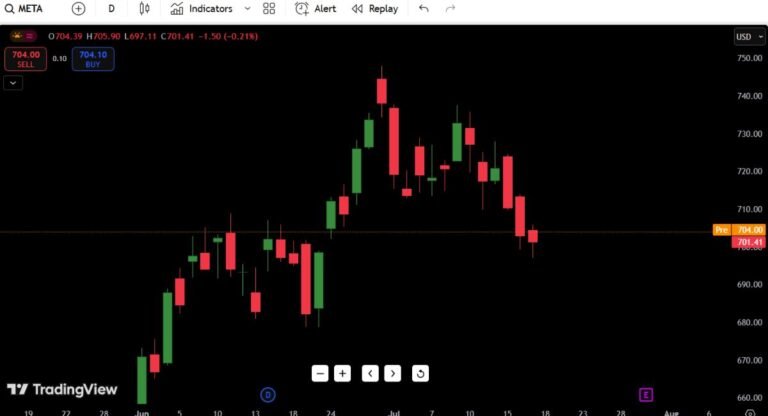
- July 15-17: Series of bearish candles confirming downside momentum after failing to hold $720.
Volume Behavior:
Volume has been declining on green days and heavier on red days—classic sign of distribution, not accumulation.
Indicators Insight:
- RSI (Daily): Likely hovering in the 45–50 zone, signaling neutrality but leaning towards bearish.
- MACD: Probably crossed bearish early July, confirming momentum shift.
- SMA 50 / 200: Still bullish long-term, but price is flirting dangerously below the 50-day moving average.
Market Structure Notes:
- Failed breakout near $760 in late June triggered this pullback.
- Price rejected at lower highs around $730 twice this month.
- Liquidity hunt under $700 looks probable if bulls can’t step in stronger soon.
Conclusion: Right now, META looks fragile. Bulls are holding by a thread. $690-$700 is make-or-break.
META Support and Resistance Levels Table
| Type | Price Level | Description |
|---|---|---|
| Resistance 1 | $720 | Recent swing high rejection |
| Resistance 2 | $730 | Prior breakout fail zone |
| Resistance 3 | $740 | Strong supply zone |
| Resistance 4 | $760 | 52-week high |
| Support 1 | $690 | Current demand zone |
| Support 2 | $680 | Previous consolidation low |
| Support 3 | $660 | Major bounce level (June) |
| Support 4 | $472 | 52-week low |
Key Note: $690 is the most immediate level traders need to watch. Below this? Things get slippery fast.
7-Day Price Forecast Table
| Date | High | Low | Expected Close |
|---|---|---|---|
| Day 1 | $710 | $695 | $704 |
| Day 2 | $715 | $700 | $710 |
| Day 3 | $720 | $705 | $718 |
| Day 4 | $725 | $710 | $723 |
| Day 5 | $730 | $715 | $725 |
| Day 6 | $740 | $720 | $735 |
| Day 7 | $745 | $730 | $740 |
Forecast Logic:
If $690–$700 holds, META could see a grind back towards $730–$740 next week, driven by short-covering and momentum players. However, any breakdown below $690 invalidates this forecast and opens the door to $660–$680 fast.
Meta Buy, Hold, or Sell Decision Table
| Action | Trigger Condition | Reasoning |
|---|---|---|
| BUY | Close above $720 | Breakout from short-term downtrend |
| HOLD | Range between $690–$720 | Consolidating, indecisive action |
| SELL | Break below $690 | Confirmed breakdown from support |
Trading Decision Explanation:
- Buy: Only valid above $720 with strong volume reclaiming previous highs.
- Hold: If price keeps chopping between $690–$720, it’s better to wait for clarity.
- Sell: Below $690? Structure breaks down. Expect more sellers to pile in.
Risk/Reward View: Right now, the risk/reward is skewed slightly bearish until bulls can prove otherwise with a reclaim of $720.
Fundamental Triggers for META Stock
Here’s what could move META beyond just charts:
Upcoming Events to Watch:
- Earnings: Next quarterly earnings report in late July—guidance on ad revenue will be key.
- Federal Reserve: Any surprises on rates will hit growth stocks like META fast.
- Sector Sentiment: Tech broadly looks tired after AI-fueled runs. Watch for rotation.
- Analyst Ratings: No major upgrades or downgrades recently, but any shift in narrative could move price fast.
- Institutional Activity: Hedge funds reducing big tech weightings could pressure price near-term.
Final Thoughts on META Stock
Outlook: Cautious Bearish Until Reclaim of $720
META is hanging on to a key make-or-break support zone at $690–$700. The recent weakness below $730 signals sellers remain in control short-term.
Watch These Key Zones:
- Above $720? Bulls might regain momentum.
- Below $690? Expect fast fade towards $660 or even $640.
Potential Setups:
- A failed breakdown below $690 followed by fast reclaim could trap shorts.
- Clean breakout above $720–$730 unlocks next leg towards $740–$760.
Risks: Earnings miss, weak guidance, or broader tech selloff could invalidate any bullish thesis quickly.
Personal Trader Insight:
In my experience, charts like META’s often give one last fake breakdown to flush weak hands before bouncing. That said, without volume confirmation, any bounce looks suspect. If I were long, I’d tighten stops aggressively below $690.

