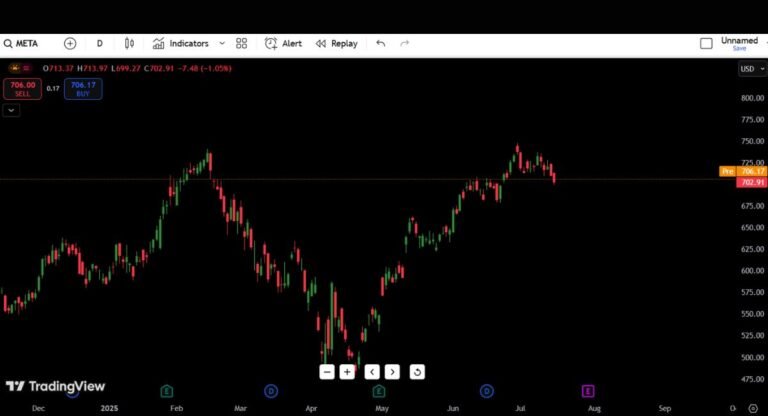
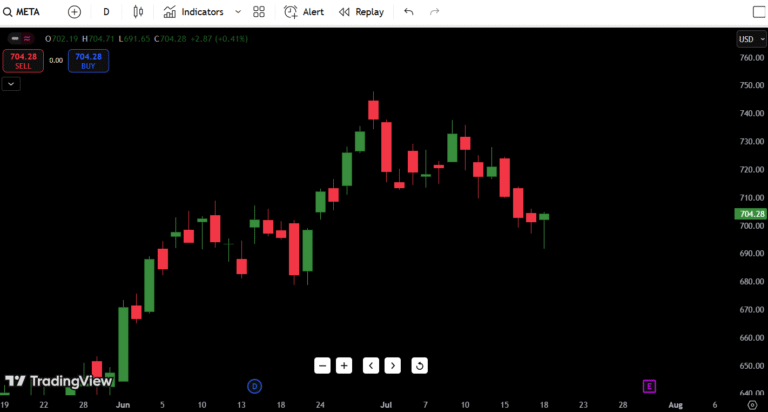
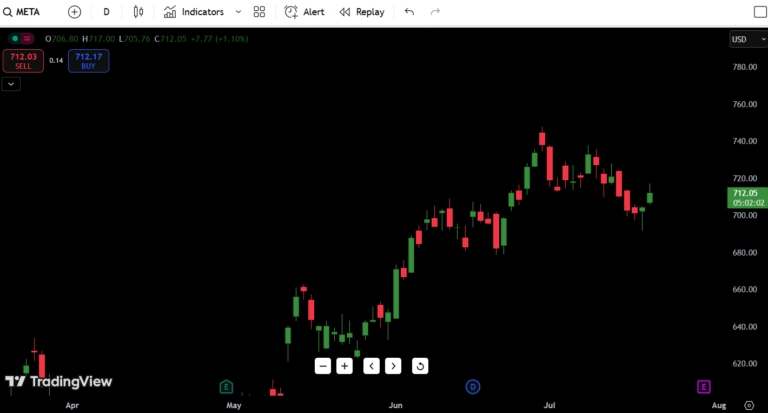
Meta Platforms (META) Stock Analysis – July 24, 2025: Buy or Bail?
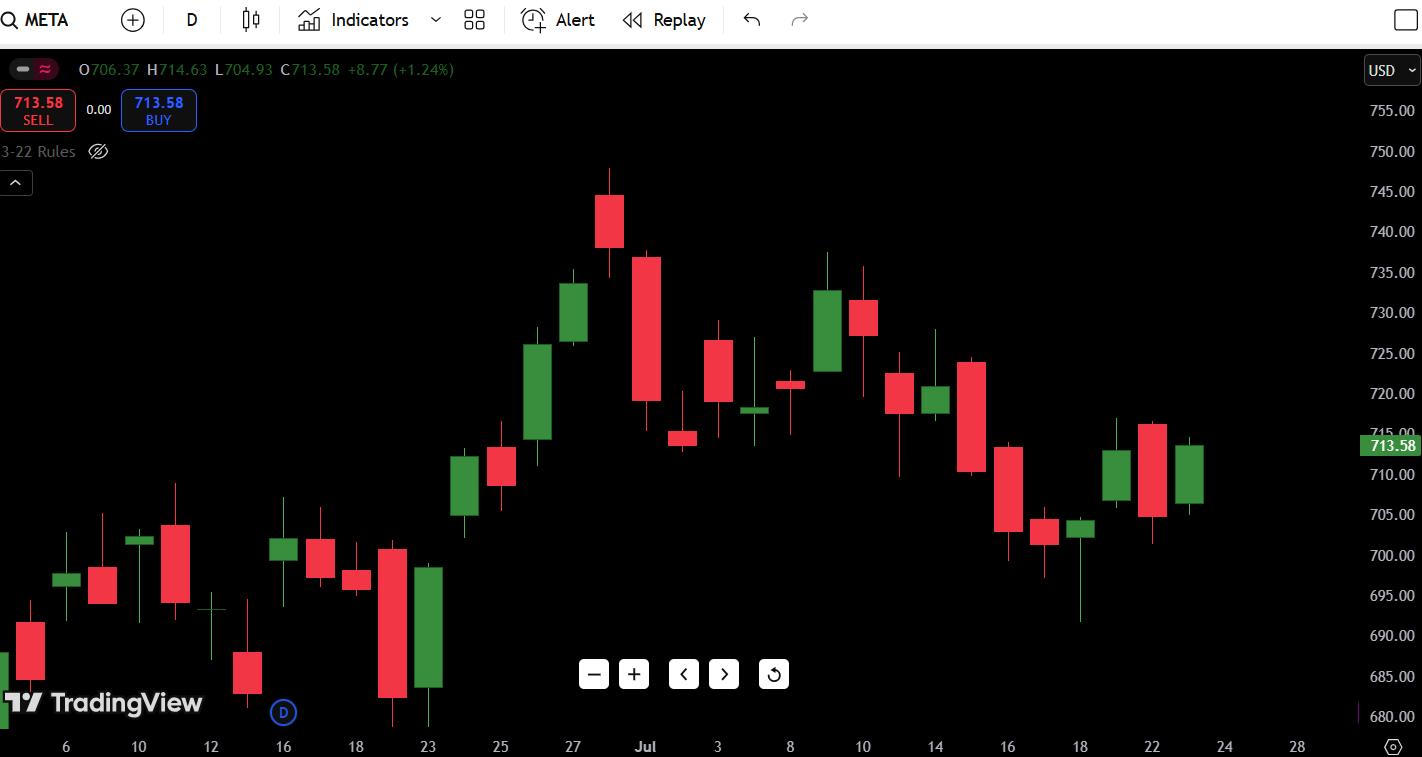
As of July 24, 2025, Meta Platforms (META) is trading at $713.58, up +1.24% on the day, bouncing off recent lows around the $700 handle. The stock is trading well below its 52-week high of $755.92, yet comfortably above the 52-week low of $468.05.
Today’s price action suggests a potential short-term reversal after several red sessions. The bounce off the $705 support zone has traders asking: is this a legitimate shift in trend, or just another dead-cat bounce in a weak structure?
The most critical zones to watch right now are:
- Immediate support near $705-$700– recently defended by buyers
- Resistance near $730–735, which has capped prior rallies
- $750–755 – the upper ceiling and 52-week high zone
This price action is especially relevant heading into Meta’s upcoming earnings and broader tech volatility. Let’s break down what the candlestick chart reveals and how to trade it from here.
- Read My Previous day : Meta Stock Analysis
Contents
Candlestick Chart Analysis
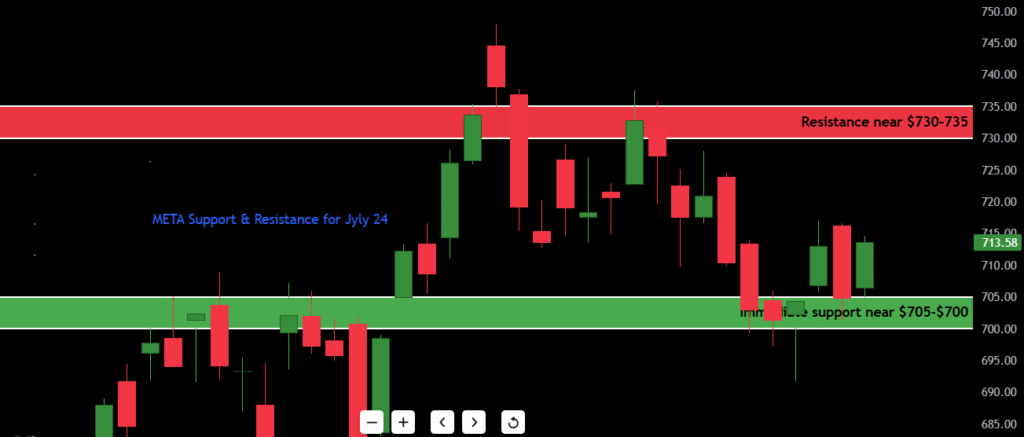
Looking at META’s daily candlestick chart, several key themes stand out.
Trend & Structure:
The broader trend appears sideways to slightly bearish in the short-term, with a series of lower highs and lower lows forming since early July. While the longer-term trend is still up (given the higher timeframe structure), recent price action has entered a corrective or distribution phase.
Candle Patterns:
The most recent candle is a bullish engulfing off the $705 support zone — a strong single-day reversal signal. This follows a hammer-style wick two days ago, suggesting buyers stepped in aggressively after a failed breakdown.
However, price has not yet reclaimed the key lower high zone around $725–$730, which remains a make-or-break resistance area.
Earlier in July, META printed:
- Bearish engulfing candles (July 1 and July 11)
- Several small-bodied indecision candles (inside bars), reflecting choppy sentiment
- A notable bearish gap on July 2, which has yet to be filled
Volume & Momentum:
Although volume isn’t visible in this screenshot, the price structure suggests waning bearish momentum. Sellers pushed hard early in the month, but recent candles show exhaustion wicks and smaller bodies — often the precursors to a relief bounce or reversal.
Technical Setup Summary:
This current move may be the start of a bounce, but META needs to close above $725 with strength and volume to confirm a shift in momentum. Until then, traders should treat this rally as a retest or potential lower high within a bearish microstructure.
Support and Resistance Levels Table
| Type | Price Level | Description |
|---|---|---|
| Resistance 1 | $725 | Recent swing high / short-term wall |
| Resistance 2 | $735 | Mini breakout trigger |
| Resistance 3 | $750 | Key rejection zone |
| Resistance 4 | $755.92 | 52-week high |
| Support 1 | $705 | Daily demand / recent bounce area |
| Support 2 | $695 | Bear trap wick low |
| Support 3 | $682 | Last confirmed higher low |
| Support 4 | $468.05 | 52-week low |
Key Level to Watch:
$725 is the pivotal resistance. A close above this level with volume could confirm this bounce as legitimate — otherwise, it may just be a fakeout rally.
7-Day Price Forecast Table
| Date | High | Low | Expected Close |
|---|---|---|---|
| July 24 | $715 | $704 | $713.58 |
| July 25 | $720 | $707 | $718 |
| July 26 | $727 | $712 | $724 |
| July 27 | $734 | $720 | $730 |
| July 28 | $738 | $728 | $735 |
| July 29 | $742 | $732 | $740 |
| July 30 | $745 | $730 | $738 |
Forecast Logic:
If META continues to hold above $705, this could be a reversal base. A grind back toward the $730–$735 zone is likely. But if bulls fail to break $725–730 with volume, expect consolidation or even a pullback toward $695–$700 before any sustained move higher.
Buy, Hold, or Sell Decision Table
| Action | Trigger Condition | Reasoning |
|---|---|---|
| BUY | Close above $730 | Breakout above lower high / strength confirmation |
| HOLD | Range between $705–$730 | Choppy action, indecision zone |
| SELL | Break below $695 | Bearish breakdown confirmation |
Action Plan:
Right now, META is in a wait-and-see zone. If you’re already long, this is a hold with tight stops under $695. If META clears $730 on volume, that becomes a buy trigger, targeting a move toward $750+. However, if we get another rejection at $725 and roll over, sellers may regain control, pushing back toward $695 or even $682.
Traders should not chase here unless confirmation comes through a strong bullish daily close above the critical resistance zone.
Fundamental Triggers
There are several macro and company-specific catalysts that could move META this week:
Earnings Report:
Meta is expected to report Q2 earnings in the next 5–10 trading days. This will be the single most important driver of near-term volatility. A strong beat with upside guidance could easily catapult META above $755.
Sector Rotation:
The Nasdaq has shown recent signs of tech rotation. If capital continues flowing out of mega-cap tech into energy and industrials, META could lag.
Macro Headlines:
Any Fed commentary on rate cuts or economic slowdown will directly affect growth stocks like Meta. Watch for inflation data and consumer confidence reports this week.
AI & Metaverse Developments:
Meta has been positioning itself as a leader in AI infrastructure and the metaverse. Any meaningful update in these areas — especially cost reduction or user growth in AR/VR — could fuel sentiment.
Final Thoughts
Outlook: Cautiously Bullish
META has shown signs of a short-term bounce, but the burden of proof lies with the bulls. If they can reclaim $730 with volume and hold it, this may signal the start of a trend reversal. Otherwise, we remain in a range-bound chop until earnings or macro data provide fresh fuel.
Key Trading Zones to Watch:
- Bullish Trigger: $730+ breakout
- Failure Zone: $725 rejection
- Bearish Breakdown Trigger: Close below $695
Personal Trading Insight:
In my experience, when a name like META hovers around critical support for too long without breaking, it’s often accumulation in disguise. But unless the breakout is clean — and supported by volume — fakeouts are common, especially heading into earnings. I’ll be watching the $730–$735 zone like a hawk. If META can flip that to support, the setup becomes attractive for a swing long. But if it fakes out again, I’ll be shorting any weakness back into the $700 zone.

